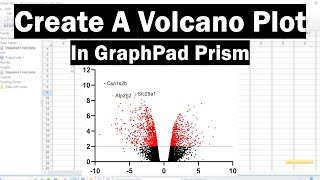
I walk through how to interpret a volano plot. I also discuss what Fold Change (FC) and p-value refer to, and what data points on the plots are significant or interesting.
What if there was a data set (RNA seq) where 2 different genes showed 2 fold expression on the x axis but one was above the p value threshold and the other wasnt, what determines the significance technically?
Dear Vincent, Thank you so much for your explanation, it makes so much sense! I have a question, our proteomics analyst said something about comparing the highly abundant and highly reduced-in-abundance protein candidates to the protein databases that are accessible by the analysis software (we use Proteome Discover 2.5), so whenever we are looking at a volcano plot, we are actually not comparing the abundance ratios between two groups, but rather two groups' values being compared to the databases with reference abundances. Is this correct or am I missing something? Kind regards, Maria
Hi Maria, I can’t answer that question as I’m not sure how those specific plots are being made. One could in theory arbitrarily choose any two groups or reference group and still get out a volcano plot.

 Наука
Наука


At 2:05, I should have said: “p value is the probability that you should accept the null hypothesis.”
very helpful! thank you so much!
Thank you very much for sharing! This is just in time for me and it's simple and clear 😀
Thanks! I'm a biologist looking at RNAseq and proteome data in a cancer model. This helps a lot in interpreting and making volcano plots.
Very informative. Thanks so much
very well explained
Thank you Sir!
thank you !
What if there was a data set (RNA seq) where 2 different genes showed 2 fold expression on the x axis but one was above the p value threshold and the other wasnt, what determines the significance technically?
Dear Vincent,
Thank you so much for your explanation, it makes so much sense!
I have a question, our proteomics analyst said something about comparing the highly abundant and highly reduced-in-abundance protein candidates to the protein databases that are accessible by the analysis software (we use Proteome Discover 2.5), so whenever we are looking at a volcano plot, we are actually not comparing the abundance ratios between two groups, but rather two groups' values being compared to the databases with reference abundances. Is this correct or am I missing something?
Kind regards,
Maria
Hi Maria, I can’t answer that question as I’m not sure how those specific plots are being made. One could in theory arbitrarily choose any two groups or reference group and still get out a volcano plot.