FRM: Exponentially weighted moving average (EWMA)

HTML-код
- Опубликовано: 13 сен 2024
- The EWMA approach to volatility is an improvement over simple volatility because it assigns greater weight to more recent observations (in fact, the weights are proportional). For more financial risk videos, visit our website! www.bionicturtl...


![Eminem - Fuel (Shady Edition) feat. Westside Boogie & GRIP [Official Audio]](http://i.ytimg.com/vi/k1OquBida9s/mqdefault.jpg)


That was extremely helpful, thank you so much David.
Thanks David you make something seemingly complex so simple
@Alveuz Hi, simple variance is the average of (m) previous squared returns; or sum of returns^2 / (m-1) is simple sample variance. Typically, the n or m would be trailing (eg, 250 days; so the last return is "moving forward" also to keep the window fixed) rather than expanding, as trailing is apples-to-apples. Hope that helps, thanks!
How come we only squared the returns as opposed to finding the difference between the current return and the mean as in: (x-x bar)?
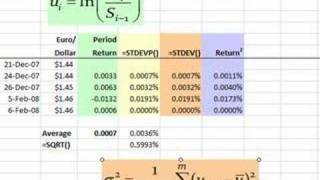
Thank you for your video. I would also add that for those calculating the historical EWMA, you should modify the formal to use today's return squared instead of yesterday's. For instance, If we are calculating the EWMA for 04-Feb-08 in this example, you would use 0.0040% ( which is U^2 for time t or n in this example) and NOT 0.0048%. I have seen this point being discussed in a financial econometrics book and many other papers. Thank you again for the video.
Hi, Dave, I was following your example to make my own one, however, I dont understand that why the preiod returns are not even correct?
The legend speaks here
Bionic Turtle, why wont you use periodic return for FEB 6?
THIS IS SO HELPFUL! THANK YOU VERY MUCH!
+Patricia Punla You're welcome! We are glad it was helpful!
Before doing Return square shouldnt we findout deviation from mean (return minus mean return) then square it and then carry on? Could u pls clarify?
Well explained! thx
Thanks for clear explanation, but EWMA in yellow it's no equal at EWMA in pink, may be I wrong .... please send me excel ....
@bionicturtledotcom thanks David, indeed it clears my mind. Can i keep making you questions? hehe currently im a phd student working with volatility forecasting with artificial intelligence techniques (like neural network), although i have more doubts about volatility. if i want to measure the precision of a forecasting technique like GARCH or EWMA, should i compare its results with the square root of the simple variance? volatility is not "truly" observable...
Awesome! Thanks David
how do you derive the lambda?
Hi David, thanks for this video. Does it makes the the weights don't sum to 1? Should the sum of the weighted returns be divided by the sum of the weights to adjust?
I'm unsure but I think this is the "estimate of variance". What do the values in column starting at .00007% represent?
5th-6th, no change. 4th-5th should be -0.00692
I agree, this is wrong
Extremely helpful, you are a God
Thank you for watching! We are happy to hear that our video was so helpful! :)
can i compare the GARCH model (which i measure the daily returns result) to EWMA? because,i get confused with the fact that EWMA model required researchers to conduct average returns (is it? and what is the minimum average of daily returns?)
or shoud i standardized the scope of this study on measuring the expected outcome using data of average value?
UP
hi David, i have a doubt on the way to calculate the simple std dev. If std deviation is the average of the previous observations of the log returns, does this means that m will continue increasing in every iteration? for example: n=10 (m=9), n=11 (m=10), n=12 (m=11) and so on. Thanks in advance
I have a question why the return is equal to ln (S_i /S_i-1)? why not equal to ewma, Mu_i = lambda * Mu_(i-1) + (1-lambda) S_i
David, what if I want to use my ewma vol numbers for the varcovar matrix. Do I also have to correct correlation?
Very helpful, thanx.
Hi David, I was wondering how would you account for the time-varying in volatility with the same decay parameter (lambda)
Hi, I know the video is old but I just wanted to know if this technique can be used for a large portfolio? Thanks!
great video thanks man
Davis is lamda constant even for a sample of 200?.Thanks in advance
@Alveuz can you bring these questions to our forum at bionicturtle(dot)com/forum, please. I can only be glib here (no edit functionality) ... to my knowledge, EWMA does not forecast. Thanks, David
Typo in last comment: Does it MATTER the sum of the weights...
May I ask, where did you get the data from?
Thanks David! If I wanted to use the 5-day return rather than daily returns for each date in the series, should I square the 5-day return, calculate the EMA and take the square root of the result as with daily returns ?
TheAksakkal Hi there! I’m building an EWMA model right now but for weekly volatility and I saw that you did the same too. I’m quite stuck! How did you do? Thanks!
Heloo, I'm trying to develop a 24h/day, 30days/month power consumption forecast algorithm (one month ahead) and I don't know which algorithm (ARMA, ARIMA, GARCH...etc) should I use... can you please tell me your opinion? Thanks
@Alveuz LOL, that was fast!
thx david
You're welcome! Thanks for watching!
noob question but why is it 1 instead of 100 if 1-94=6?
1-0.94 = 0.06