Basic Principles Scanning White-Light Interferometry

HTML-код
- Опубликовано: 29 сен 2024
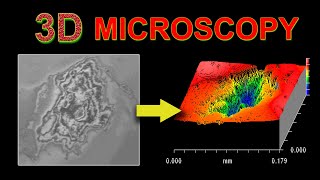
- The topography measurement is based on a technique called white light interferometry that scans the surface height of the test object. To achieve this, a beam-splitter divides the beam coming from a white light source into two parts. The reference beam is reflected from a reference plane, while the measurement beam is incident on the test object. When changing the distance between the sample and the interferometer, optical interference occurs at every point of the surface where the optical path length is exactly the same for the reference and the measurement beam. During the vertical scan, the interference patterns are captured by the video camera while the software computes the topography from this data.
Find out more: www.polytec.co...
Follow us:
/ polytec-inc


Why do we use white light?
In a normal interferometer, we use a single wavelength light source (Laser). The light detected at the camera is the interference pattern (bright & dark peaks) of the "reference beam" and "measurement beam." If you move the distance traveled by one of the beams, the interference pattern will change, because your beams are interfering at different points in space. If the reference beam = sin(x) and the measurement beam = sin(x), then you move measurement beam distance = sin(x+1), your waves combine differently.
White light is a composite of many wavelengths (colors). Each wavelength has a different period (example: red = sin(x), blue = sin(2x)). When the distance of the reference beam and measurement beam is the same, all wavelengths will produce a constructive interference pattern at the camera. When you change the distance of the measurement beam (like when reflecting it from an uneven surface), you get different interference patterns for each of the wavelengths. red = sin(x + 1) and blue = sin(2x + 1).
If you plot the sin functions into a graphing tool, you'll be able to visualize better visualize this explanation.
Is it possible to use this for say glas flasks?
This technique has been applied to many different applications, including glass surfaces. Please contact Polytec and we are happy to give you additional information info@polytec.de