Surfer New Feature: 3D Gridding

HTML-код
- Опубликовано: 28 авг 2024
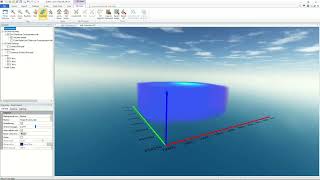
- 3D Gridding in Surfer is here! Now you can grid true 3D XYZC data such as subsurface soil or groundwater contamination, mineralization concentration, seismic refraction velocity, temperature distribution, or dissolved oxygen concentration.
Once gridded you can save the results to a 3D grid in VTK format. Then, create a map from the 3D grid, adjust the slice value displayed in the 2D map, and then visualize the entire 3D grid in the 3D view as a volume render and isosurface.
Start creating interactive 3D models of your own, download the Surfer free trial today: www.goldensoft...


I have used this program for petroleum geology maps. It's easy and straightforward.
Every day I watch your programs, I am more and more convinced that they arebest among all programs
Instead of concentration, can I use to and from interval data. The concentrations of a mineral are located at certain interval instead of a point
Hi there,
You can grid To From interval data if the data is loaded in as Drillhole data. Once loaded as Drillhole data, you can use the Home | Grid Data | Grid Data command and select the Drillhole XYZC command to be able to select your Interval data. For more information, see this Help page: surferhelp.goldensoftware.com/griddata/grid_data_select_data.htm?Highlight=grid%20data
Best,
Golden Software
Very useful program
Can the surfer locate archaeological objects?
Hello,
We do not have experience with, or support, any hardware or data collection devices; we manufacture software that allows you to visualize data. This data can be anything, and we and our programs have no way of knowing what the data is, or what values are significant for what you are searching for, so we cannot help you interpret the results. If you do not know what your data represents, please contact the dealer or manufacturer of the equipment.
Best,
Golden Software
Thank you very much. Could you please specify for us the method of extracting the data x y c d
Hello,
The data used in this example is a sample dataset. Golden Software does not sell or support data collection devices and isn't able to offer insight into data collection methods.
Thank you,
Golden Software
How can I get the gold concentration data in this video? So can I obtain this data through remote sensing, or what is a different way?
Hello,
The data used in this video is a sample dataset. Golden Software only sells software to visualize data and does not have information on how to best collect data in the field. To find that information we recommend contacting the providers of data collection equipment.
Thank you
I only have files in XYZ format, how can I convert this to more formats? Please help
Hi Allen,
If you are looking to convert an existing grid to a different file type you can use the Grids | Convert command. However, if you want to create a 3D grid your data needs to have 4 variables (XYZC). You can grid any 3 variables of data with the standard gridding commands.
If you specific questions about your dataset we would recommend reaching out to support@goldensoftware.com.
Thank you
@@GoldenSoftware Thank you very much for your explanation
Can it use kriging interpolation?
i have the surfer 23 version and i can't find this configuration!
Hello,
Thank you for your comment! 3D Gridding is a new feature available in versions of Surfer 25 and above. To determine if you are eligible to upgrade, or purchase a maintenance renewal in order to do so you can visit this link: support.goldensoftware.com/hc/en-us/articles/115004499654-How-do-I-know-if-I-have-active-maintenance-
Golden Software Support
Sufer can dete t gold treasures or ores underground
Thank you for your comment!
We do not have experience with, or support, any hardware or data collection devices; we manufacture software that allows you to visualize data. Surfer can visualize data you already have, but cannot detect it. This data can be anything, and we and our programs have no way of knowing what the data is, or what values are significant for what you are searching for.
bathymetry data correction tutorial for average water level and tides
Hi Ramatia,
Thank you for your comment! Currently we do not have resources related to correcting bathymetric data. I am happy to file a request with our support team to eventually create resources related to this workflow.
Golden Software Support
@@GoldenSoftware Ok, thank you