Interpretation of linear regression in SPSS

HTML-код
- Опубликовано: 10 окт 2024
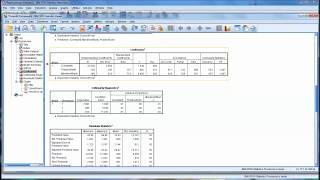
- What do R, R square, Adjusted R square, T statistic, F ratio, significance (p) value in regression mean?
This video is a part of Analyse Quantitative Data with SPSS Module. To go through the full learning module visit: modules.projec....
To read more about this presentation visit:
www.projectgur....


how much important R square value as I am facing less values in my model but all other requirements like p value is significant. can I use this model or not to be mentioned in my research report? kindly guide
R square is important but you can work with a lesser value, like around 0.4. If its lesser than that then try to modify your dataset by removing a variable or adding a new variable.
@@abhigyanscolourfulworld1710 thank you, actually i have .076 R square value with 4 independent and 1 dependent vatiable
its social sciences research
@@SociologistKhan this value is good, you can proceed and mention it in your report.
@@abhigyanscolourfulworld1710 okay. Thank you