How to Make Crop Phenology Curves and Automate Field Boundaries with Planet Data and APIs

HTML-код
- Опубликовано: 26 авг 2024
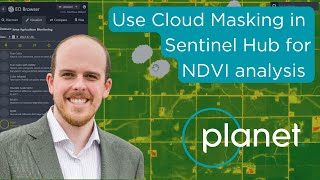
- In this short demo, you will see how easy it is to visualize all the Planet data layers using our Sentinel Hub APIs for time series analysis within your applications or R&D tools. Planet offers all the earth observation data you need to solve the complex problems facing agriculture today.
🛰️ 🌎 Since Planet’s acquisition of Sentinel Hub in 2023, Planet customers can now manage, stream, and analyze Earth observation data from multiple satellite constellations directly into your GIS software of choice.
Start by learning how to use Field Boundaries, a Planetary Variable that automatically finds fields or parcels of land and serves as the foundational framework for a wide range of analyses.
📈🌱 Then, easily generate Crop Phenology curves, and monitor crop growth as time series data all within the Planet platform. Crop Phenology curves are the key to unlocking so much information in agriculture. They are essential for:
🔴 Crop management
🔴 Defining windows for fertilizer application
🔴 Irrigation scheduling
🔴 Disease prevention
🔴 Crop type classification
🔴 Yield estimation
🔴 Harvest timing
Learn how to call other APIs in the Planet platform, and check out other data layers including Land Surface Temperature, Crop Biomass, Normalized Difference Vegetation Index (NDVI), and rapid batch processing.
Want to watch more demos, or learn more about our Field Boundaries tool? Watch our 20-minute webinar on Field Boundaries here: go.planet.com/...
Music License Code: ASLC-29A2BFED-32EE5169B6