Spotlight Visualization in Excel (Part-2) | Highlight your top performer with Spotlight

HTML-код
- Опубликовано: 11 сен 2024
- #Infographics #Spotlights
Hello Friends,
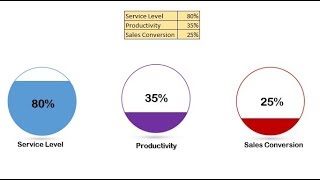
This is the second part of Spotlight visualization in Excel. Here we have used the spotlight to highlight the top performer in the chart. We have created a Column Chart for Team Manager wise sales and highlighted the team manager with the highest sales.
Spotlight Visualization in Excel (Part-1)
• Spotlight Visualizatio...
Click here to download the practice file:
www.pk-anexcel...
Download our free Excel utility Tool and improve your productivity:
www.pk-anexcel...
See our Excel Products:
www.pk-anexcel...
Visit to learn more:
Chart and Visualizations: www.pk-anexcel...
VBA Course: www.pk-anexcel...
Download useful Templates: www.pk-anexcel...
Dashboards: www.pk-anexcel...
Watch the best info-graphics and dynamic charts from below link:
• Dynamic Graphs
Learn and free download best excel Dashboard template:
• Excel Dashboards
Learn Step by Step VBA:
• VBA Tutorial
Website:
www.PK-AnExcel...
Facebook:
/ pkanexcelexpert
Telegram:
t.me/joinchat/...
Twitter:
/ priyendra_kumar
Pinterest:
/ pkanexcelexpert
Send me your queries on telegram:
@PKanExcelExpert
************ Suggested Books ********
VBA: amzn.to/2TMMikX
Excel Dashboard: amzn.to/2WZi2Fj
Power Query: amzn.to/2Ibd7xR
Power Pivot and Power BI: amzn.to/2DCg8BB
Exam Ref 70-778 (Power BI): amzn.to/2GnWYTN
************ My Stuff ***************
Mic : amzn.to/2TLnF88
Video Editor: screencast-o-m...


![MISSING: SLIM SHADY [Expanded Mourner’s Edition Trailer]](http://i.ytimg.com/vi/xh8qgHrOO1g/mqdefault.jpg)

I appreciate your Class!!! Simple and Objective!!! Tks for this innovative ideas!!! Grate work!!!
Thanks for your valuable feedback. Request you to please share this with your friends and colleagues.
That's great! Thank you!
Thanks for your valuable feedback
It's really great, but Sir, I explained so quickly that I can not save the way this flow chart works. I'm very happy because I'm involved in this interesting channel.
Thanks for this beautiful video.
Thanks for your valuable feedback
Buen trabajo amigo..!! Excelente
New Innovative ideas. #Success555
Thanks for your valuable feedback
Great Video PK, thank you so much
Thanks for your valuable feedback
Thanks for your valuable feedback
Awesome job sir 👏👏👏👏👏 was waiting for this 😊
Thanks for your valuable feedback
Amazing , thank you
Thanks for your valuable feedback
Awesome
Thanks for your valuable feedback
great work, g
Thanks for your valuable feedback
Thank you
Thanks for watching
Great my friend, nice visual, i hope someday you canbe create dynamic scatter plotting on map used coordinate XY, thank your share..👍
Great
Thanks
What a telent owsome
Thanks for your valuable feedback
Awesome work, but same as others have that is data labels are not visible if the numbers are changed
Could you help us with this
Can't we arrange the shape without utility tool...
Vos sabés que lo pude hacer, lo único que no me funciona bien es la etiqueta del valor máximo... cuando el valor máximo se actualiza, el hombre cambia de posición pero la etiqueta no muestra nada.. las fórmulas están bien .. el problema me parece que está cuando lo guardo y lo abro nuevamente.... Incluso en el ejemplo tuyo tampoco me funciona.... Me ayudas a entender el problema? Graciassss
sir recalculate krne k bad kuch data labels gayab ho ja rahe h
But sir its not running in my excel as you please give some advice?
How to download this shapes pls try to make a clear videos..