Five Number Summary, Boxplots, and Outliers | Statistics Exercises

HTML-код
- Опубликовано: 24 июл 2023
- We find the 5 number summary of a data set and use it to construct a box and whisker plot and then a modified boxplot which represents outliers specially. The five number summary of a set of data consists of the minimum, the first quartile, the median, the third quartile, and the maximum. Then, Q3-Q1 is the interquartile range or IQR, and this can be used to classify outliers. #statistics
What is a 5 Number Summary? • What is a 5 Number Sum...
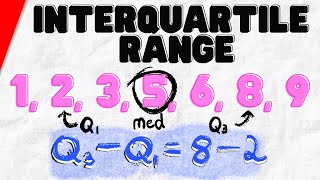
Interquartile Range: • How to Find the Interq...
◉Textbooks I Like◉
Graph Theory: amzn.to/3JHQtZj
Real Analysis: amzn.to/3CMdgjI
Abstract Algebra: amzn.to/3IjoZaO
Linear Algebra: amzn.to/43xAWEz
Calculus: amzn.to/3PieD1M
Proofs and Set Theory: amzn.to/367VBXP (available for free online)
Statistics: amzn.to/3tsaEER
Discrete Math: amzn.to/3qfhoUn
Number Theory: amzn.to/3JqpOQd
★DONATE★
◆ Support Wrath of Math on Patreon for early access to new videos and other exclusive benefits: / wrathofmathlessons
◆ Donate on PayPal: www.paypal.me/wrathofmath
Thanks to Loke Tan, Matt Venia, Micheline, Doug Walker, Odd Hultberg, Marc, Roslyn Goddard, Shlome Ashkenazi, Barbora Sharrock, Mohamad Nossier, Rolf Waefler, Shadow Master, and James Mead for their generous support on Patreon!
Outro music is mine. You cannot find it anywhere, for now.
Follow Wrath of Math on...
● Instagram: / wrathofmathedu
● Facebook: / wrathofmath
● Twitter: / wrathofmathedu
My Math Rap channel: / @mathbars2020


I tried to be exceptionally brief but still helpful in this video - as brevity seems to be one of the primary ways to break into highly competitive video topics such as this one. If I can spend all my time making math videos someday, I'll just make hour long Game Theory and Graph Theory lectures.
You explained this better than my math teacher
Thanks this helped me study for my upcoming test!
How is Mr beast following u 😮
im writing my exams soon and i want to understand if my maximum is only 6 on the box whisker plot and calculating the upper whisker limit is more than my maximum, do i include the outlier in the box whisker plot or just leave it out? i dont know if im making sense
your video helped me a lot btw, thank you
Is the diagram skew to the left or skew to the right
You’re the best math teacher ever!!❤❤
Thank you!
Thanks for this I have an exam tomorrow on universal data or whatever and I play games in class normally so this really helped me out.😁
Glad to help, good luck!
Thank you so much.
Glad to help!
Hi I’m not sure if I’m wrong but to fine the median the formula is (n+1)/2 so n = 10 number, (10+1)/2 = 5.5 so it would be at the position 5.5 in the number range, there fire the mean would be (3+4)/2 = 3.5 which u r correct. But for the Q1 the formula would be (n+1)/4 so (10+1)/4 = 2.75, so it would be at the position 2.75 therefore cannot be directly in the middle of 1 and 2, you are wrong because u didn’t count in the 0.5 between 3 and 4.
The correct answer for 1st quartile would be
(10+1)/2 = 2.75
So it would be at positron 2.75
Position 2 = 1
Position 3 = 2
And you want to find position 2.75 so you would need to find the 0.75 between 1 and 2
To do that:
You take 2-1 = 1 and then 1 x 0.75 which would give you 0.75
0.75 then add to 1 (position 2) and you get 1.75
1st quartile would be 1.75
So your answer is wrong
And the 3rd quartile is wrong also
Just draw a cf table and find it man.
Thanks!
Glad to help! Thanks a lot for the Super!
Thank you so much❤
Glad to help - thanks for watching!
Well explained 😮
Thank you!
thanks for the carry
i gotchu
How did you get 6 ?
Since the outlier is 10, he changed the graph so that the max would be 6
Isnt the median 3.8?
That is the “mean”, look up definition of median for how to find the median
Cool
Statistics is!
Q1=n+1/4 and Q3=3(n+1)/4 🤨