Investing: The Shiller PE

HTML-код
- Опубликовано: 12 фев 2021
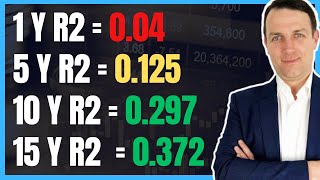
- This video describes the Shiller PE ratio (also known as CAPE or PE10). The Excel CORREL function is used to calculate the inverse correlation between the Shiller PE and the S&P Composite index's subsequent 10 year annualized average return. An X-Y scatterplot and a 2 axis line chart are also used to illustrate the negative correlation.


This channel is so great, so much underrated!
Thank you for doing such a great job man
Awesome! Can you share this sheets?
What this is telling investors is that the US market is overpriced. What follows from that is either very low returns going forward or a crash
Thumb up from HONG KONG trader in ibank
How would you apply the shiller pe to other markets?
Well scripted for me 😍