This video is helpful, but the formula you are using for variance is not as it's detailed in my text so I am a bit confused. My text says Variance is (X - mean)^2 (P(x)). Is that the same as what you are doing here? It seems like it, but I want to be sure. Thanks!
+HerdingDogRescuer The formula you give is correct. The version I used: Sum( x^2 * P(x)) - mean^2 is an alternative version that is easier to use for calculation. Either one will give the same answer. Thanks for watching the video.
+Jenine Guerrero So to find the range of usual values, you take the mean + or - 2 standard deviations. Thus, for the example take the mean of 1.57 and then add and subtract 2 times 1.358. This gives you a range of usual values of -1.146 to 4.286 approx.
I square rooted the Variance. To square root a number you raise it to the 0.5 power (not multiplication by 0.5 - it is an exponent). I.E. Variance ^ 0.5 = Standard Deviation.
009rud, Could you explain how to compute the median value of this data? Tkns! f.e.: I computed the cum. freq. and then I use FIND(50, cum.freq column, x column)
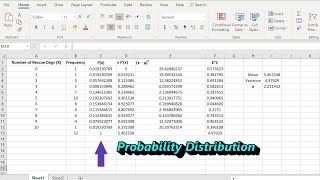
This is a probability distribution and not really a set of data. However suppose the probabilities were calculated from 100 cars, then we would have 29 cars with no defective tires, 24 cars with 1 defective tires and so on. thus we list 0,0,0, 29 times 1 24 times and so on. Median is the 50th percentile and so the 50th we list would be 2. However in this set of data median does not have much meaning since only 5 discrete values of x are present. That is why we get the expected value or mean instead.


You are my saving grace! I FINALLY understand this!!!!!!!!!!
This video is helpful, but the formula you are using for variance is not as it's detailed in my text so I am a bit confused. My text says Variance is (X - mean)^2 (P(x)). Is that the same as what you are doing here? It seems like it, but I want to be sure. Thanks!
+HerdingDogRescuer
The formula you give is correct. The version I used: Sum( x^2 * P(x)) - mean^2 is an alternative version that is easier to use for calculation. Either one will give the same answer. Thanks for watching the video.
Thanks, man!! very helpful
why is it raised to the .5 on the standard deviation?
The standard deviation involves taking a square root. taking a square root is the same as raising it to the 0.5 power.
can you add finding the range of usual values?
+Jenine Guerrero
So to find the range of usual values, you take the mean + or - 2 standard deviations. Thus, for the example take the mean of 1.57 and then add and subtract 2 times 1.358. This gives you a range of usual values of -1.146 to 4.286 approx.
I dont understand where all those numbers came from?
Why you square rooted the std x 0.5?
I square rooted the Variance. To square root a number you raise it to the 0.5 power (not multiplication by 0.5 - it is an exponent). I.E. Variance ^ 0.5 = Standard Deviation.
009rud, Could you explain how to compute the median value of this data? Tkns! f.e.: I computed the cum. freq. and then I use FIND(50, cum.freq column, x column)
This is a probability distribution and not really a set of data. However suppose the probabilities were calculated from 100 cars, then we would have 29 cars with no defective tires, 24 cars with 1 defective tires and so on. thus we list 0,0,0, 29 times 1 24 times and so on. Median is the 50th percentile and so the 50th we list would be 2.
However in this set of data median does not have much meaning since only 5 discrete values of x are present. That is why we get the expected value or mean instead.
God bless you friend
x squid