How to a Make Frequency Density Histogram From a Grouped Frequency Table - Unequal Class Widths

HTML-код
- Опубликовано: 19 окт 2023
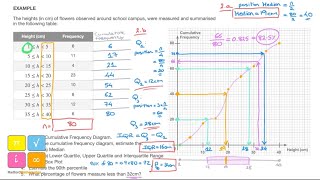
- We learn how to draw, or construct, a frequency density histogram starting from a grouped frequency table for continuous data.
We start by adding a class width column as well as the frequency density column and then we learn how to draw the frequency density histogram.


hey it’s me! roman, your student from grade 8! going through calculus right now ❤