Matching a Weibull Distribution to a Data Set in Excel

HTML-код
- Опубликовано: 11 сен 2024
- This video was created for Penn State's course AERSP 880: Wind Turbine Systems, by Susan Stewart and the Department of Aerospace Engineering (www.aero.psu.edu).


It's really rare to find such a clear and effective guide on youtube.
Thank you.
Ten years later this video is still helping people. Thank you for this tutorial!
This was such a helpful and clear guide- very grateful for this! Thank you so much!
Thank you very much Susan. This video was so helpful.
many thanks Susan, it's simple, very helpful and easy to remember
How do we get the value of u bar. Is it the peak of histogram?
how do you find the scale parameter?
Really rare and informative. Thank you
I will put a wind rose screencast on my to-do list!
I have many zeros in my wind data, how should I treat these meassurements? are they a problem with the meassuring device?
Hi and thanks for the video. I'm wondering, how could I find the shape and scale factor. As I see, these are the given values for your calculation. Could I find them through a given wind speed data point?
do you need the same data or any one
Can you tell me how to determine the scale parameter (sigma) for Rayleigh method ?
Thanks in advance
very well explained, i am bit confused that how weibull distribution overlap the windspeed histogram.
Hi, could you tell me if the numbers in the "column of hour" are to indicate in which time has been collected the data, because normally the range is of 10 minutes between each reading.
Thanks in advance for your response!
Nice work! This video was very useful to me, thank you so much!
How did you calculate frequencies for different bins?? I tried to calculate frequency for 1 bin,but 1 m/s means range of values from 1 m/s to 1.9 m/s and if i count frequency for 1.9 m/s also there is 0.9 m/s difference from 1 m/s. Will it not give error while teting wind turbine??? In short what range of values should i take into consideration while finding frequency for say 1 m/s???
Thank you for this video, please I have a question, how do we estimate the failure function, if I have the number of data exactly 20
Dear Mam Can we have a sample dataset ?
what is K, U_bar, and lamda?
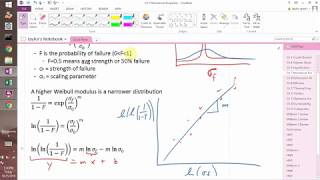
parameters of Weibull distribution.
Think he means how do you solve for them?
what if the bins are not regularly distributed ?
say the frequencies are given for velocity ranges 1-3 , 4-7 , 8-10 , 11-13 , 14-17 , 18-23 , and more than 23
how it can be handled ?
thanks
You would need to multiply the calculated Weibull probability distribution values by the bin size. You can check if you've done this correctly by summing up the probabilities. The sum should approach 1.
Thanks very much for this very helpful tutorial. I am currently trying to figure out a way to use this for earthquake predictions, I have as input data the days between earthquakes but I do not know how to estimate the shape parameter... If I multiply the days with the density does the sum of it all has to equal 1?
What are you plotting on the histogram?
when the video start at 0:35 seconds , i wonder how do you get 1.225 from ? is that from the formula or else? it's shown that 0.5*1.225*C4 thankyouu
1.225 is air density at standard temperature and pressure. You can find it from the ideal gas law.
very clear and helpful, thanks so much
Thank you, this video is very helpful, but I have one question:
There are cases in which, even though the average weibull wind power density matches the real average wind power density, it is very clear (visually) that the weibull curve doesn't fit the histogram. If using a different shape factor leads to a much better fit, visually speaking, but it doesn't reach the wind power density desired: should I use that factor or the one calculated using the solver?
I would very much appreciate if you could answer me, thank you!
If you are able to find a better fit manually, you should also check that the average wind power density isn't too far off from that found from the data. This is an important measure for understanding the wind resource at the site. In the case that the curve you've matched to the data clearly doesn't fit, and the one which seems to visually fit better doesn't match the average wind power density, it is likely that a Weibull distribution is not the best way to model that data set.
Really helpful, thank you!!
Hi... finding the weibull distribution is fine . but how you are calculating the frequency? and do we need any actual wind measurement data for calculating the the weibull distribution? suppose i have 8760 wind speed hourly data.how i can find the weibull distribution for a day?
I have the same question. Did you find the answer ? Hehe
Do you a pdf tutorial for these set of videos
excellent. thank you!!
Can you guys make a video explaining how to fit a wind rose to a set of data using excel?
Thanks!!!!
Motivational voice. XD
I agree with you my friend!