Iron Carbon Diagram Full Details- Material Science iron-carbon diagram

HTML-код
- Опубликовано: 10 сен 2024
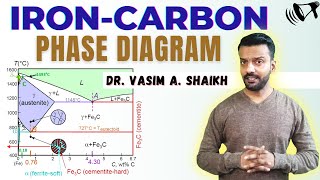
- Cast iron is not interesting for our considerations. On the vertical axis of the iron-carbon diagram we find the temperature in °C. The metals are shown here from solid to liquefied state. Pure iron begins to melt at 1,147°C. The melting point is 1,536°C. On the horizontal axis we find the percentage of carbon in the metal or structure.
The drawn lines mark the transformation of the metal. Between these transformation lines are sections in which the metal is in a certain state. For example, the conversion from solid to liquid state is shown. But also the reorganization of the atoms can be read. The iron-carbon diagram shows the sections in which the metal only has a certain condition. These are melt, Ferrite or Austenite. Other areas are characterised by combinations of properties. These are, for example, melt and Austenite, Austenite and Ferrite, Ferrite and Perlite.
The marking of the intersection points with capital letters on the conversion lines is meant for better understanding. These indicate the transition to another state or condition.
The iron-carbon diagram assumes a constant cooling of the metals. If the metal is slowly cooled down, coarse grains are formed. If the metal is cooled down quickly, fine-grained metal is the result. The type of metal grain determines the strength properties. Coarse grain has a lower strength, but can be made finer-grained and therefore stronger by heat treatment or forming. Fine-grained metal already has a high strength level.