Cross filter visuals in Excel | Amazing interactive charts | Excel Off The Grid

HTML-код
- Опубликовано: 23 июл 2024
- ★ Want to automate Excel? Check out our training academy ★
exceloffthegrid.com/academy
★ Check out the blog post★
exceloffthegrid.com/cross-fil...
★ About this video ★
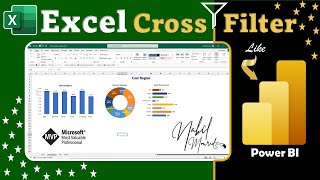
Power BI has a really nice way of cross-filtering visuals. When you click on a visual, it highlights the selected item in other charts, while also retaining the total value in a lighter color. Can we cross filter visuals in Excel? No. But we can create something pretty close.
0:00 Introduction
0:25 Data
1:16 Calculations
5:38 Create the charts
6:27 Create the slicers
7:40 Formatting and presentation
15:30 Conclusion
★ Download 30 most useful Excel VBA Macros ebook for FREE ★
exceloffthegrid.com/
★ Where to find Excel Off The Grid ★
Blog: exceloffthegrid.com
Twitter: / exceloffthegrid
#MsExcel


Superb. My organization prefers that everything be in Excel because everyone has access to it. This type of exposition really helps those of us in this situation. Thanks.
Well, I hope you can put it to good use and make some nice interactive reporting.
Your tutorial and solutions were amazing! Thank you so much, and congratulations on your fantastic presentation style.
Thanks Fabi - I really appreciate that. 😁
Thank you so much. Great start of my Friday morning.
You're welcome. I'm glad you enjoyed it.
Your white hair fits you well. Excellent work, and thanks for sharing.
Thanks 😊
Thanks Mark.Excellent as always👍
Thanks Kebin 😁
Great video. There is a lot to learn here. I will have to watch this video several times.
Thanks. There are several useful techniques in here. The key thing is putting them together in the right way.
These are all techniques we cover in our training program.
Thank you, great job, just used this to creat a Power BI look alike dashboard for PMO Dept. Great stuff.
Fantastic! That's great news, I hope it goes down well.
That’s very very smart method. Really respect buddy.
Thank you, I’m glad you liked it.
Awesome 👏 !
Thank you! 😁
Oh my , oh my, oh my !! amazing Mark!
Thanks Carlos. Though, knowing your style, I suspect you would have used a PivotTable with the Slicers, instead of a Table. 😁
Fantastic Mark. Incredible everything that can be learned with this great video that you have published. Thank you very much for sharing so much knowledge.
Thank you. Yes, lots of interesting techniques in there. When they are combined in the right way 💥
Thank you for the beautiful slicer video. I really like that technique you used on the data; include using the subtotal, and the selected vs unselected items. Neat concept.
Thanks. Hopefully it's given you a few ideas of how you can use it in your work.
MUCHAS GRACIAS,.!!
You’re welcome.
What a super video Mark! Is it also possible to include columns year and quarter here? In what way should this be done?
14:45 presentation
Thanks bro... Can you make a video of the python in Excel?
I'll still waiting to see where the real value is from using the new Python in Excel. Once I've established that, I'll definitely make some videos.
what is the use of this light grey color in the chart bars? what does that represent? I think it is only "selected" values that should appear in the chart..why is the grey portion "unselected" appearing? It is wrong representation
The light grey is the total value.
For example the left chart is the total value of all regions broken down by item. By "cross-filtering" from the chart on the right, we can see how much of each item is North, South, East, West, or any combination of these.
These types of visuals are common in Business Intelligence software.
@@ExcelOffTheGrid can you please share the excel you used?