Sir thank you for your explanation its is amazing and can you please upload on explanation of Student's t-distribution in briefly with calculations 🙏🙏🙏
Suppose you have 2 variables x and y. You have the sample mean of x ,the population mean of x and the sample mean of y. You are told to estimate the population mean of y. How do you go about it
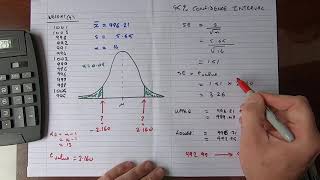
A mathematics test was given to 486 students prior to joininga certain college. From these students, a simple random sample of size 10 was taken and reported as given below: Achievement test (x) 39 43 21 64 57 47 28 75 34 52 Final calculus mark (y) 65 78 52 82 92 89 73 78 56 75 If the mean score for the 486 students in the achievement test (x) was 52, estimate the mean score for all the 486 students in the final calculus exam and determine the 95% CI for the estimate
Those are individual weight numbers from the population. Given there are over 2000 people in the population, I am using notation to show how you would add them without showing all the numbers as I can't put 2000 numbers on the screen.
There was no guessing. My first example was small and my second was large. I could not show all 2,239 points of data so instead I showed the notation of what it looks like and said you would probably add it in a software than do it by hand. The emphasis was understanding the formula and not being intimidated by the size of the population you are calculating.
It is notation to show the over 2000 observations. I can't show all on the screen so I used three numbers with "..." To show that the method is the same even though the amount of observations is much higher than the previous example.
The population mean and sample mean calculation look the same from an aesthetic perspective. The different symbols are there but each are related. For example, N is population total whereas n is sample total. Mu is the average for the population and xbar is the average for the sample. A sample is a subset of the population, which this video below shows: ruclips.net/video/LuovTf3MEzg/видео.html


Support the channel and purchase from Amazon through this link with no cost to you: amzn.to/43PwRLN
Thank you! I now have a better understanding on how to read/calculate these formulas.
Sir thank you for your explanation its is amazing and can you please upload on explanation of Student's t-distribution in briefly with calculations 🙏🙏🙏
Sure, is next week too late?
Suppose you have 2 variables x and y. You have the sample mean of x ,the population mean of x and the sample mean of y. You are told to estimate the population mean of y. How do you go about it
The sample mean is the estimate of the population mean by definition.
Is there more to the question?
A mathematics test was given to 486 students prior to joininga certain college. From these students, a simple random sample of size 10 was taken and reported as given below:
Achievement test (x)
39
43
21
64
57
47
28
75
34
52
Final calculus mark (y)
65
78
52
82
92
89
73
78
56
75
If the mean score for the 486 students in the achievement test (x) was 52, estimate the mean score for all the 486 students in the final calculus exam and determine the 95% CI for the estimate
plz how did you find those numbers 77.5 ,65.7 and 88.9
Those are individual weight numbers from the population. Given there are over 2000 people in the population, I am using notation to show how you would add them without showing all the numbers as I can't put 2000 numbers on the screen.
I don't understand how you summarized the data for the second example. Do you just guess or what?
There was no guessing. My first example was small and my second was large. I could not show all 2,239 points of data so instead I showed the notation of what it looks like and said you would probably add it in a software than do it by hand. The emphasis was understanding the formula and not being intimidated by the size of the population you are calculating.
Sirr thank you so much can you make a video about getting the parameter propotion, and variance
Sure but can you clarify what you mean by parameter proportion? I don't know what that exactly is in my vernacular.
I dont know the exact of propotion but variance you know the formula sorry for wrong grammar
No problem. Here is the population variance; ruclips.net/video/Y3AT1CmTk9M/видео.html
I dont understand the 4 calculating.....where did you take 77.5, 67.3, and 88.9? please explain
It is notation to show the over 2000 observations. I can't show all on the screen so I used three numbers with "..." To show that the method is the same even though the amount of observations is much higher than the previous example.
Thank you sm
Hi. Where did the data values from the 2239 people came from? Thanks. Im not really good at math so its hard for me to understand
That is the number of people in the city.
I am still confused, if this is the calculation of population mean so what will be the sample mean?
The population mean and sample mean calculation look the same from an aesthetic perspective. The different symbols are there but each are related. For example, N is population total whereas n is sample total. Mu is the average for the population and xbar is the average for the sample. A sample is a subset of the population, which this video below shows:
ruclips.net/video/LuovTf3MEzg/видео.html
Thank you :)
You're welcome!
I am confuse, so basically it is ok for the population mean to have a decimal point?
Most averages have decimals. It is very rare to find a mean without a decimal point outside of a classroom.
@@Learn2Stats thank you for your response i badly need it for my assessment
@@ano4037 No problem. If you have any more questions on other topics. Let me know.
くさんありますありがとうございます」、
どういたしまして