How do I make the pie chart by simply selecting the whole list of pets in column two and then inserting a pie chart from there? Because Google Sheets is smart enough to know that's what I want when I do that. I would assume Excel has caught up to such a basic idea by now.
You can do that as a short cut. If you want control of which data are being graphed, as you might want when you have a lot of different data in an Excel file, then you want to follow the steps shown in the video.


Woo how helpful can a video get!! Immensely grateful for this video
Great vid. Just what I needed!
Thank you very much 👏🏻
This is exactly what I needed. Thank you so much ❤
This video was very helpful. Thanks a lot.
You're awesome. Thanks!
This Video has helped me today, exactly what I was looking for ..Thank you :)
great video
This helped me a lot! Thank you!!
same!!!!
OMG! it was very helpful. thanks🌹
Thank you, this was very useful!
THANKYOUUU. ITS REALLY HELPFULL
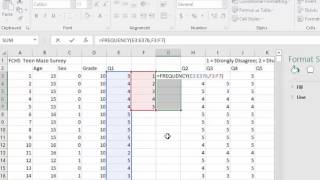
2:25 creating a relative frequency table
How do I make the pie chart by simply selecting the whole list of pets in column two and then inserting a pie chart from there? Because Google Sheets is smart enough to know that's what I want when I do that. I would assume Excel has caught up to such a basic idea by now.
You can do that as a short cut. If you want control of which data are being graphed, as you might want when you have a lot of different data in an Excel file, then you want to follow the steps shown in the video.
tq!
How can you show the labels as in which people are dog people who are cat people who are bird people in your chart ?