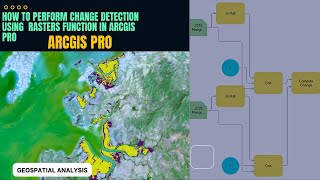
Change Detection in ArcGIS Pro

HTML-код
- Опубликовано: 3 фев 2025
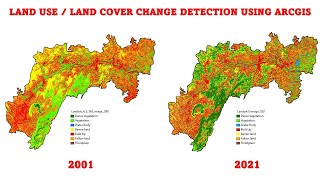
- In this video I talk about Change Detection in ArcGIS Pro with a focus on quantifying changes using spectral indices. Specifically Near Difference Vegetation Index (NDVI).
For the video on Adding Raster Data to ArcGIS Pro, Find the link Here:
• Adding Raster Data to ...
For the video on Landsat 8 Band Combinations in ArcGIS Pro, Find the link Here:
• Landsat 8 Band Combina...
📺 Subscribe To My Channel and Get More Great Content: www.youtube.co....
🕰SCHEDULE
Videos are uploaded every week. Make sure to Subscribe and hit the Notification bell to be notified when videos go live.
👤Connect with me:
/ wencelaus. .
/ wencelaus.na. .
/ wencelaussi. .
/ wencelaussimiyu
Discover ArcGIS Pro: bit.ly/2FqwA9q
ArcGIS Pro Free Trial: bit.ly/2QPfpUk


Please make a video on change deduction on city built-up area changes in last 5 years
Nice job! Normally, I would expect that one would use bands 5 and 4 for Landsat 8. I'm assuming you made some previous definitional modifications in your band data to arrive at a 4 and 1 combination. I was just interested in what you did. Also, I like reversing the ribbon for the symbology that you selected to show vigorous vegetation as blue rather than red. Anyway I know it is a preferential thing. I've subscribed to your site because you go slow (for us older folks) and you are straight to the point. Thanks!
Thanks a lot for your feedback! Yes you're right, I made definitional modifications and will be sure to always mention such elements in my future videos.
Nice job. What could be the reason why NDVI values for 2017 ranged from
-1 to 1 while that of 2019 ranged from 0 to 200?
That's a great question Wycliffe. I have used two different approaches. So for the first result (2017 image) with the result -1 to 1, I have used the "Scientific output option" while for the second result (2019 image) I have used the ArcGIS Pro default equation used to generate the output which is as follows:
NDVI = ((IR - R)/(IR + R)) * 100 + 100
.
This results in a value range of 0 to 200. This value range fits within an 8-bit data structure, which can easily be rendered with a specific color ramp or color map.
@@WencelausSimiyu Thanks for the detailed response ✅, I get it now.
You're welcome