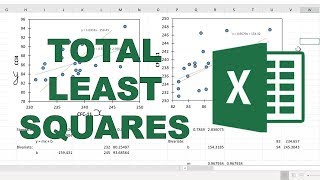
How to make a correlation matrix in excel using a bubble chart

HTML-код
- Опубликовано: 6 авг 2024
- In this video I show you how to plot a correlation table as a correlation matrix where the size of the circle and the color of the circle represent how good the correlation is. In this video we use power query to unpivot the table and a bubble chart to plot the correlations.
--------------------------------------------------------------------------------
#exceltutorial #excelcharts #exceltipsandtricks
SUBSCRIBE: goo.gl/c46YPs
Microsoft Office 365, 2016, Office Insider, Version 1902
These data are related to my PhD research
---------------------------------------------------------------------------------
IF YOU LIKED THIS VIDEO YOU MAY ALSO LIKE:
- How to make a map in excel using a bubble chart • How to make a map in e...
- How to conditionally format a bubble chart in excel • How to conditionally f...
- How to delete cells diagonally in excel • How to delete cells di...  Наука
Наука


Thank you for this tutorial. It was very stretching based on my skill level, but still accomplishable. My data set is quite different from yours and I had to start over several times to adjust the process for my type of data... but I am very proud of myself for actually accomplishing this. Thank you.
Great tutorial!
Nice! 🤩 At the end, can we jump to final conditional columns steps to create the final matrix chart if we want it in colors, right?
How do you create the query with Excel2019?
Hi, thank you for the good tutorial! but how do you implement negative correlation values into the matrix, because they do not appear!
Do you have a solution for this?
Make a new column with the negative numbers converted into positive numbers using an IF formula i.e. =IF(A1
Hello, Professor, I want to make this kind of babble graph, I used 2013 excel office but my office haven't transform option and povt, option , so could you help me,
I am using power query in this video which is included in excel 2016 but in excel 2013 and excel 2010 it is an add in that you have to download. See this video for more information: ruclips.net/video/gwW2CDdvUUs/видео.html
You can also unpivot a table using a pivot table which might be easier for you instead of having to download something. ruclips.net/video/N3wWQjRWkJc/видео.html
Question: Technically shouldn't your formula have an = on one side or the other. For example either a = ??? I realize your true data is several digits deep but what if an answer was exactly 0.5 ??? I don't think the formula would catch it..... right????
Hi, Thank you. The tutorial was so useful. I used power query for transforming data but at the stage of plotting, when I define the y values in the bubble chart, strangely all of them are converted to zero. The problem is not specific to my laptop's excel or even to a column of data. When I put other data (transformed by the power query) into the y values of bubble chart the problem emerges. Have you experienced such an issue? Do you recommend any solution for that?
In power query make sure the numbers are being stored as numbers and not as text. Do the cells have a green triangle error in the corner? You could also try selecting the column and then delimiting it using text to columns. Or copy and paste the numbers as values to a different column.
@@karinaadcock I had converted the x and y values to text and the z values to the whole number. I also copied and pasted the data as their values to another sheet but the problem persists. If I assign random numbers to x, y and z and plot the bubble chart there is no problem but it is specific to data transformed by power query I think.
the x and y values need to be converted to numbers not to text
@@karinaadcock Thank you. I could plot the graph by y values as numbers but the values are actually text and I should convert the numbers to text finally. When I replace the y values with text the chart collapses to zero values on the y axis!
I forced to replace the numeric y values by text, manually.
How to incorporate significance.....***, **, * and ns?
I made this video about adding significance to a table: ruclips.net/video/OtgAp_E5erU/видео.html
You could use data labels values from cells to get the * into the chart