How to use BlenderGIS for Population Density 3D Maps

HTML-код
- Опубликовано: 31 янв 2024
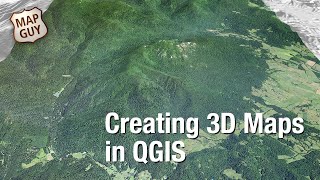
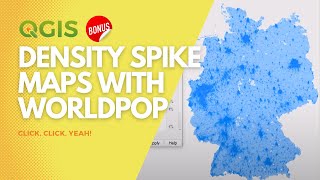
- Architects rely on GIS to visualize, analyze, and interpret spatial data at the scale of cities or territories, which is especially useful for urban design. In this video, we'll produce a 3D population Density Map with the free and open-source add-on BlenderGIS for Blender.
GIS data can be found on official Geodata websites such as geoportail.gouv.fr for France : it always contains interesting metadata, like the amount of people living on a specific territory. Let's take a look at how to visualize it in 2D in the open-source mapping software QGIS, and then at how to transform it into 3D in Blender using BlenderGIS.
Link to download BlenderGIS : github.com/domlysz/BlenderGIS  Наука
Наука


![Sean Rii, Karyon, Sharzkii - Taungule [My Love] (Official Music Video)](http://i.ytimg.com/vi/eJoMuypbSzQ/mqdefault.jpg)


Te quedo genial, me pregunto cómo hiciste esa animación donde los picos más alto de la densidad de población inicia de abajo hacia arriba.
¡Muchas gracias! Puedes añadir un keyframe en la scale al final de tu animación, y poner otro keyframe con la scale en Z=0 al principio. Voy a hacer un short a principios de la próxima semana para mostrarle
Hi:) i followed step by step your tutorial, but when i clicked import shp to blender, the result is: shapefile import fails, check logs. Do you know why?
Hi, yes I have already seen this too. It may be for some geometries. But despite this message, you do get the import, don't you?