Diagrammes en Boite à Moustache dans R| Comment dans R?| caps 48

HTML-код
- Опубликовано: 18 сен 2024
- Dans cette capsule, je t'emmene dans l'univers des Diagrammes à Boite à Moustache dans R.
Prends du plaisir a apprendre avec
#CommentdansR
Diagrammes en Boite à Moustache dans R| Comment dans R?| caps 48
*************Codes*********
library(ISLR)
data("Credit")
head(Credit)
dim(Credit)
attach(Credit)
boxplot(Income,main="Diagramme en Boite a
Moustache", ylab="INCOME (in 10,000$)",
horizontal = FALSE, notch = TRUE)
axis(2,at=seq(0,175,by=25),labels= seq(0,175,by=25))
boxplot.stats(Income)
21.0035-1.5*IQR(Income) ;57.6045+1.5*IQR(Income)
for(i in 1:length(Income)){
if(Income[i] inf (-33.69175)|Income[i] sup 112.2998){
cat(Income[i]," ;", sep = "")
}
}
unique(Ethnicity)
table(Ethnicity)
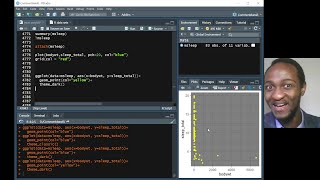
boxplot(Income~Ethnicity,data = Credit,
col="gold", border="orangered3",
xlab="Ethnicity",ylab="INCOME",
main="Income par Ethnicity",
pch=20, cex=0.8, cex.lab=0.8,cex.axis=0.8,
cex.main=1.8,yaxt="n",
varwidth=TRUE,notch=TRUE)
axis(2,at=seq(0,175,by=25),labels= seq(0,175,by=25),
cex.axis=0.8)
box(col="pink",lwd=2)
+++++++++++++++++++++++++++++++++++++++++++++++++++++++
unique(Cards)
table(Cards)
unique(Gender)
table(Gender,Cards)
boxplot(Income~Gender*Cards,data = Credit,
col=c("red","wheat"),
main="Distribution de Income
par Gender et Cards",
xlab="INCOME",cex=0.7,cex.axis=0.8,las=2,
varwidth=TRUE, horizontal=TRUE)
detach(Credit)


![[9-R studio-L3] Graphiques GGplot2](/img/1.gif)
tu m'as vraiment aider merci à toi ! que Dieu te récompense
Ca fait enormement plaisir de le savoir.. Keep pushing Sasa.. et a ta priere je dis Amine!
Merci bcp..cela m'a bcp aidé
Objectif atteint donc.. Merci Fatou.. #CommentdansR