thank you so much sir for this information. but can you help me with a question. i just want to know how you have calculated percentage activity?? i am having trouble with it
Thanks!. What if your curve is not linear? I suppose a log transformation of concentration values improves the linearity?. Also, after log transformation, and the R-square value is still not great, I am not sure the IC50 would be accurate. Any thoughts?
Hi I don't understand how to find ic 95 in this kind of exercise. could you help me? In the article, the difference in 28-day mortality between the Lopinavir / Ritonavir group and the Standard Care group was -5.8%. Mortality was rated as similar in both groups. Among the following fictitious results, which one or which will lead us to conclude that the mortality between the two groups is similar? (The 95% confidence interval is given in square brackets) Result A: Mortality difference: -16% [ -30%; -2%] Result B: Mortality difference: -5.8% [-11%; -0.6%] Result C: Mortality difference: -2% [-17%; 13%] Result D: Mortality difference: -0.5% [-3%; 2%]
Thanks, everything crystal clear and well explained. Just one question: is it possible to evaluate also the IC50 slope with Excell? prism is able to give me one, but I have no idea how to do it in excell (because sometimes graphpad prism doesn't like data :C)
Please, how we can calculate the concentration value if all activity % were superior than 50%, here the equation will not be useful because we will get a negative concentration value, is there any solution?
Sir i tried to this with my experimnetal data where the max concentration applied was 40IJ /ml and after calculationg LC50 was 42.90, sir how can be LC50 (which is 42.90IJ/ml) value more the the concentration (40IJ/ml) we applied. please help me with this doubt.
For each well absorbance calculation, I used the control group and found the absorbance percentages and calculated their averages, but did you choose the control group while you were plotting the graph in excel? i don't understand it
Sir in my calculations the c value which I got is more than 50 so after calculation the value comes in minus. Please tell me how to calculate in such situation
@@learnmicrobiologyfromdr.ga7869 Sir can I calculate ic50 value from zone of inhibition (mm) in antibacterial activity for a compund I did my my work by agar well diffusion method in three different concentrations and I measured the zone of Inhibition in milimeter. So can I calculate ic50?
@@learnmicrobiologyfromdr.ga7869 Sir there is not any formula to convert the mm of Inhibition growth to percentage?? Can i convert by comparing with antibiotics control
This is a very poor example of an IC50 calculation, and the method chosen to calculate it is incorrect. Drug-receptor interactions do not follow linear functions and cannot be modeled using linear regression. The data set the presenter chose is insufficient and does not cover a wide enough range of % activity to make an accurate calculation. I don't think he actually understands what a real IC50 curve looks like.


simply great video. thanks a lot
thank you so much sir for this information. but can you help me with a question. i just want to know how you have calculated percentage activity?? i am having trouble with it
To find the percentage cytotoxic activity values, which formula did you use to process the drug absorbances, could you please share?
TE AMO BRO
SALUDOS DESDE MEXICO
Thank you so much it was really helpful.
Well explanation..
Thanks
THANKS for explaining in a simple way. can we use it for ic50 in writhing test?
If you liked the video, please support us by subscribing to our channel..
Thank you .. clear explanation
Thank you so much, it was very helpful!
If you liked our video, please subscribe to my channel
how can I find the IC50 value from sigmoid curve(non-linear).
how did you get the activity percentage?
thanks its really helpful.
thank you very much I really needed this
Please subscribe to our channel and promot among your friends...
Very nice and easily understanding.
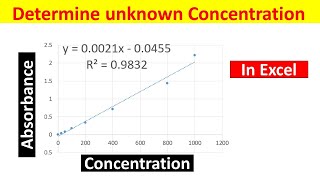
What is the chart title on viability graph? Please let me know, I need to present the article better.
%cytotoxicity Or % cell survival as per the formula you used...
Thanks!. What if your curve is not linear? I suppose a log transformation of concentration values improves the linearity?. Also, after log transformation, and the R-square value is still not great, I am not sure the IC50 would be accurate. Any thoughts?
Yes you are right, this method is applicable only on linear fit with high R-squar values. In other cases you can use different models...
@@learnmicrobiologyfromdr.ga7869 Thanks so much. Any models in mind?
Absolutely perfect video.
Thankyou sir.
Thanks, please subscribe to our channel and promot among your friends...
Sure Dear sir✌
Hi I don't understand how to find ic 95 in this kind of exercise. could you help me?
In the article, the difference in 28-day mortality between the Lopinavir / Ritonavir group and the Standard Care group was -5.8%. Mortality was rated as similar in both groups. Among the following fictitious results, which one or which will lead us to conclude that the mortality between the two groups is similar? (The 95% confidence interval is given in square brackets) Result A:
Mortality difference: -16% [ -30%; -2%]
Result B:
Mortality difference: -5.8% [-11%; -0.6%]
Result C: Mortality difference:
-2% [-17%; 13%]
Result D: Mortality difference: -0.5% [-3%; 2%]
instead to Y value 50, just put 95 and do the calculation...
Simple and very helpful 👍🏼
If you liked the video, please support us by subscribing to our channel..
Thanks, everything crystal clear and well explained. Just one question: is it possible to evaluate also the IC50 slope with Excell? prism is able to give me one, but I have no idea how to do it in excell (because sometimes graphpad prism doesn't like data :C)
Yes it's possible, I have explained using Excel only..
@@learnmicrobiologyfromdr.ga7869 I'll look for it. Thanks!
Thank you very much sir 🙂
Thank you so much Sir
Please make a video on ice 50 of antioxidant
Sure I will do that shortly...thanks...please subscribe to our channel...
what if graph is not linear? how can you achieve this?
Thank you Doctor
Hi this too simple thank you but my ic50 come with - charge what should i doo
Thank you sir for sharing your knowlege
If you liked our video, please subscribe to our channel
can we use these both formulas for antioxidants
Yes you can..
What is the accepted range of R-square value here, like should it be above 0.9?
Near 1 (+or-), better it is...
Thanks, really helpful.
Thanks, please subscribe to our channel and also share with your friends...
Please, how we can calculate the concentration value if all activity % were superior than 50%, here the equation will not be useful because we will get a negative concentration value, is there any solution?
Sir i tried to this with my experimnetal data where the max concentration applied was 40IJ /ml and after calculationg LC50 was 42.90, sir how can be LC50 (which is 42.90IJ/ml) value more the the concentration (40IJ/ml) we applied. please help me with this doubt.
Good video
What do you do when your c value is higher than your y which 50 and hence getting a negative number
the same in my case. have you done anything about it? plz sugggest
Please suggest I am getting negative value.. When c is above 50
Very nice vedio
Thanks. Great help
Thanks, please subscribe to our channel and also share with your friends...
Thank you so much : )
Please subscribe to our channel and promot among your contacts....thanks
Very informative vedio
Please subscribe to our channel...
I have in doubt why u have two formulas like Y=(Mx+C) and Y=(Mx-C), it may be related to positive regression and negative regression
Good
Pls what is name of technique .
Thanks
Sir. What wo should do if IC50 value is in negative?
You can repeat your Experiment....
When ve calculate İC50 we use kontrol group mean value or not
U hv to calculate ic50 seperately for each group
For each well absorbance calculation, I used the control group and found the absorbance percentages and calculated their averages, but did you choose the control group while you were plotting the graph in excel? i don't understand it
@@hediyeklc2592 he didn’t add the control group
Sir in my calculations the c value which I got is more than 50 so after calculation the value comes in minus. Please tell me how to calculate in such situation
this method fit only when your data is on leaner line
@@learnmicrobiologyfromdr.ga7869 Incorrect sir. IC50 curves are not linear.
Sir my data follows the linear line the R square value is 0.9796 but still I get c value more than 50. Please suggest some solution
@@asawarikulkarni9029 chechk your setting is 50 or 50%
Very helpful
If you liked the video, please support us by subscribing to our channel..
Sir. What should be the r square value??it should be more than 0.9??
Of its near to 1, than it's good...
@@learnmicrobiologyfromdr.ga7869
Sir can I calculate ic50 value from zone of inhibition (mm) in antibacterial activity for a compund
I did my my work by agar well diffusion method in three different concentrations and I measured the zone of Inhibition in milimeter. So can I calculate ic50?
@@surjitdeka7092 no it's not possible, it's possible only if your data is in %
@@learnmicrobiologyfromdr.ga7869
Sir there is not any formula to convert the mm of Inhibition growth to percentage?? Can i convert by comparing with antibiotics control
Thank you
If you liked the video, please subscribe to the channel...
thank you sir
Please subscribe to our channel....
ye LC50 calculate kiya hai,,,,,,,,,,,,,,?
Sir m value hme kha se milegi
This is a very poor example of an IC50 calculation, and the method chosen to calculate it is incorrect. Drug-receptor interactions do not follow linear functions and cannot be modeled using linear regression. The data set the presenter chose is insufficient and does not cover a wide enough range of % activity to make an accurate calculation. I don't think he actually understands what a real IC50 curve looks like.
🙏
I don't think this should be in linear equation
this was really really helpful
If you like our video, please subscribe to our channel
U are a life saving thx 🤍🤍🤍🤍