
- Видео 36
- Просмотров 469 181
Researchocrat
Индия
Добавлен 14 сен 2011
At Researchocrat, we're passionate about empowering researchers, data analysts, and GIS enthusiasts with the tools they need to excel in their fields. Our channel is dedicated to providing clear, comprehensive, and practical tutorials on using QGIS and R Studio - two powerful tools at the forefront of spatial data analysis and statistical research.
Generate Random Points & Extract Coordinates in CSV Format | QGIS Tutorial
Download Study Area Polygon: drive.google.com/file/d/1pTw154rfJ19skYdPkW7eBXXpecNwjXCj/view?usp=sharing
In this tutorial, you'll learn how to generate random points within a specified area and extract their coordinates into a CSV file using QGIS. We'll start by setting up a base layer to define the area for generating points. Next, we'll use the Random Points Inside Polygons tool to create points with a specified minimum distance between them
In this tutorial, you'll learn how to generate random points within a specified area and extract their coordinates into a CSV file using QGIS. We'll start by setting up a base layer to define the area for generating points. Next, we'll use the Random Points Inside Polygons tool to create points with a specified minimum distance between them
Просмотров: 231
Видео
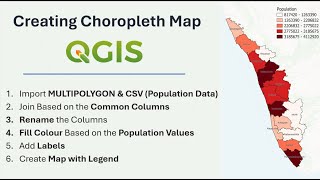

How to Prepare a Choropleth Map Using Population Data | QGIS Tutorial
Просмотров 371Месяц назад
Download Multipolygon & CSV : drive.google.com/drive/folders/1AvBw2eTd_vjp1hqJBxwW6GUMyWItT8OW?usp=sharing Creating Study Area Map : ruclips.net/video/Y2WoZmNs-kI/видео.html Choropleth maps are a type of thematic map where areas are shaded or patterned in proportion to the value of a variable being represented. These maps are particularly effective for visualizing geographic distributions and p...
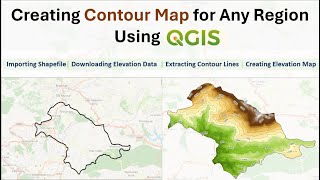
Prepare Elevation Map with Contour Lines in QGIS | Latest Tutorial
Просмотров 1,9 тыс.2 месяца назад
Download the Vector Polygon (Shapefile) & DEM Raster Layer: drive.google.com/drive/folders/1am4maXjCLBW3sIpwpBqfmSooLCVNpfk7?usp=sharing How to Extract Shapefile (Vector Polygon) of any Area: ruclips.net/video/Y2WoZmNs-kI/видео.htmlsi=N-I4qCfrvSboJkeC This tutorial will help you visualize topography using NASA's SRTM Digital Elevation data. Follow along as we import vector polygons, clip raster...

Calculate the Area Covered by Polygon Shapefiles in QGIS | Latest Tutorial
Просмотров 1422 месяца назад
Download the Vector Polygon: drive.google.com/file/d/1DeDSqJIjmN-7O61VH9JXw1TJ3ZNtmclD/view?usp=sharing Understanding the total area covered by the polygons can provide insights into spatial patterns, such as the distribution of land use types, habitats, or administrative boundaries.

Reverse Geocoding in QGIS: Extract Location Details & Save as CSV | Latest Tutorial
Просмотров 6463 месяца назад
Download Point Data (.csv) : drive.google.com/file/d/17jXv4vf2CxdJ-QEW3gsY_iFVKPcw5bhf/view?usp=sharing In this tutorial, we dive into the world of geospatial analysis by demonstrating how to perform reverse geocoding using the MMQGIS plugin within QGIS, utilizing OpenStreetMap data. Reverse geocoding is a powerful technique that converts geographic coordinates into readable addresses or locati...

Creating Bubble Map in QGIS | Tutorial 2024
Просмотров 1,3 тыс.3 месяца назад
Download Files: drive.google.com/drive/folders/1posCyjS_UgT4rfxK26iBRQ4IQbejdh4X?usp=sharing Creating Shapefiles & Study Area Map: ruclips.net/video/Y2WoZmNs-kI/видео.htmlsi=SmZIifpy-1YtGOv4 Creating a bubble map in QGIS involves visually representing data points with circles whose sizes are proportional to a data variable. This type of map is useful for showing relative magnitudes or frequenci...

Create HYSPLIT Particle Dispersion (PM2.5) Model In R
Просмотров 6264 месяца назад
Download R Script : drive.google.com/file/d/14Cd32kfsrfprVvstUGsEnp-vHf3EBP-R/view?usp=sharing The HYSPLIT (Hybrid Single Particle Lagrangian Integrated Trajectory) model is a comprehensive tool used for computing air parcel trajectories, simulating the dispersion and deposition of pollutants and hazardous materials in the atmosphere. Developed by NOAA's Air Resources Laboratory, HYSPLIT is cap...

Change the Colour of a Polygon (Shapefile) and Save it in QGIS
Просмотров 8615 месяцев назад
Learn how to change the color of vector polygons (Shapefiles) and Save it in QGIS. Download shapefile: drive.google.com/file/d/1b0FUUlvFEIixcUGs7MT2Kfh-ec0mUFHg/view?usp=sharing

Adding Coordinates into QGIS Map | Grids & Coordinates
Просмотров 2,6 тыс.5 месяцев назад
Shapefile (GEOJSON): drive.google.com/file/d/1VOgxsrLrq8X81iohubfKEYoRYVHO2I-U/view?usp=sharing
Easy Steps to Convert KML to SHP (Shapefile) and Back in QGIS
Просмотров 2,2 тыс.6 месяцев назад
Download the Shapefile : drive.google.com/drive/folders/19MQoXamxwo0KXTyn2CVBu0CEA2YcAo5f?usp=sharing
Creating Shapefile and Study Area Map for any Location | Latest Tutorial using QGIS
Просмотров 43 тыс.6 месяцев назад
Sampling Stations Data: drive.google.com/file/d/1AyU_LG5Htx86EiGrMFbezz8adeoHalhV/view?usp=sharing In this tutorial, we'll guide you through the process of creating a Shapefile and generating a Study Area Map. We'll cover the inclusion of grids, coordinates, and legends to ensure your map is informative and visually appealing, no matter the location you choose.
Statistical Tests for Comparing Two Groups | Explanation and Implementation in R
Просмотров 1887 месяцев назад
R Script: drive.google.com/file/d/10d9fASDpTr6XFVpdWagzU1vRfpfDyqxY/view?usp=sharing Dataset: docs.google.com/spreadsheets/d/1Agu7aDRSTgHgZ0EOmn2lRniHAhyNpKc_/edit?usp=sharing&ouid=115945506978729556576&rtpof=true&sd=true
PERMANOVA in R | Explanation and Implementation
Просмотров 6 тыс.7 месяцев назад
Data set: docs.google.com/spreadsheets/d/1GqcgIOqVh7vm7YLKBu-L3u2ziSEH_j3t/edit?usp=sharing&ouid=115945506978729556576&rtpof=true&sd=true R script: drive.google.com/file/d/1_ew-p0aokoZ8z7pJN0pemnRXY08zoVD-/view?usp=sharing NMDS Tutorial: ruclips.net/video/_lFO_BA5nUs/видео.htmlsi=JG9zMp95XwYnyT4P
Principal Component Analysis Tutorial & Interpretation Using R
Просмотров 1,2 тыс.8 месяцев назад
Download Pizza Dataset: drive.google.com/file/d/13pVPc-tvd8m2E8wygXh56SsjxEAu2QTQ/view?usp=sharing Download R script: drive.google.com/file/d/1OZebquFKTsKFXYObdvk1rJjXwLKfdklH/view?usp=sharing
Create an Interactive Leaflet Map in R Studio | Add Shapefiles & Pop-up texts
Просмотров 1,7 тыс.9 месяцев назад
Download the shapefile, rainfall data, and R script: drive.google.com/drive/folders/1kmbibCdZsW7ErZU2zM_ji6NCt4LiAaCy?usp=sharing
Calculating the Area covered by Pixel Classes Under a Polygon | QGIS Tutorial
Просмотров 1,2 тыс.9 месяцев назад
Calculating the Area covered by Pixel Classes Under a Polygon | QGIS Tutorial
Extract Features as Polygons from Openstreet Map in QGIS | QuickOSM Plugin
Просмотров 3,3 тыс.9 месяцев назад
Extract Features as Polygons from Openstreet Map in QGIS | QuickOSM Plugin
Download and Visualize Google Open Buildings Data| Earth Engine + QGIS
Просмотров 3,8 тыс.9 месяцев назад
Download and Visualize Google Open Buildings Data| Earth Engine QGIS
Create Heat Map and Density Polygons in QGIS
Просмотров 14 тыс.10 месяцев назад
Create Heat Map and Density Polygons in QGIS
Spatial Interpolation (IDW)Tutorial Using QGIS
Просмотров 14 тыс.10 месяцев назад
Spatial Interpolation (IDW)Tutorial Using QGIS
Cropping Raster using a Shapefile in QGIS | Clipping Raster
Просмотров 4,4 тыс.Год назад
Cropping Raster using a Shapefile in QGIS | Clipping Raster
Download TROPOMI Air Quality Data from Google Earth Engine Without any Code | TROPOMI Explorer App.
Просмотров 3,7 тыс.Год назад
Download TROPOMI Air Quality Data from Google Earth Engine Without any Code | TROPOMI Explorer App.
Create HYSPLIT Wind Trajectory Models in R Studio | Tutorial
Просмотров 1,9 тыс.Год назад
Create HYSPLIT Wind Trajectory Models in R Studio | Tutorial
Perform Time Series Forecasting in R Studio | ARIMA & ETS Models
Просмотров 7 тыс.Год назад
Perform Time Series Forecasting in R Studio | ARIMA & ETS Models
Create Windrose Diagram for any Location in R using NASA POWER Data
Просмотров 6 тыс.Год назад
Create Windrose Diagram for any Location in R using NASA POWER Data
Importing Coordinates CSV file into QGIS and Labelling the Points
Просмотров 14 тыс.Год назад
Importing Coordinates CSV file into QGIS and Labelling the Points
Why Researchers Must Learn R | RStudio
Просмотров 9722 года назад
Why Researchers Must Learn R | RStudio
Getting World Shapefile and Selecting Individual Countries in QGIS
Просмотров 34 тыс.2 года назад
Getting World Shapefile and Selecting Individual Countries in QGIS
Customize plots using 'ggThemeAssist' - No codes required | R Studio
Просмотров 4333 года назад
Customize plots using 'ggThemeAssist' - No codes required | R Studio
How to correct Spelling Mistakes in Data frames using R
Просмотров 1,7 тыс.3 года назад
How to correct Spelling Mistakes in Data frames using R
perfect explaination
It will be really helpful if open street map area is used for the tutorial ...which are more used than considering national parks which have low points ...
Sorry, I couldn't find the picture of the effects at 5:39 in the publication you cited underneath it..
How can extrac district shapefile
How to remove some stations?
Thank you so much
Thanks very much brow ❤
thanks, dear from Pakistan Gilgit Baltistan......lots of love
Lucky to find your video to cure my headache.
In the layout window, I'm getting this prompt "Scene not set" and my map is not coming Can someone help
Nice, thank you
Grazie
Thank you very much for sharing!! This is super helpful!
Amazing video ❤
Peux-tu avoir la version française ?
I'm from Cameroon, i watch a lot of videos, but the only 5min spend here help me a lot. Thank you Sir. You're among the people who knows the impact of education in technology
@@arthursaa6856 Thank you! ❤️
You are very talented teacher ❤😍 I like to know how I can draw arrows and lines thanks
Firtsly thank you. I would like to learn how to cut with rivers?
thank you so much about this vedio
Tried modeling another forest fire, it only modeled one single particle. Why is this happening? All I did was change the dates and location.
Out of thousands of GIS videos ur videos are really good, im new learner of GIS tnx. I hv degree minutes map and If i want to make 2cm=1km grid refence map what shoul be my x y values in EPSG 3857....
Was very helpfull
My identify features isn't working what should I do
Same
Thank you for such an explanatory video
ESRI is not found wt to do sir
Sir couldn't download raster tiles in SRTM downloader
How do you prevent a current catchment area from lying on the map as the previous catchment you have worked on? I tried working on different projects but they all end up lapping together
Hi, why cant i use GDAS data? It is said the files are removed from the drive and I can't use it. Thanks
Amazing Tutorial, Bro
omg thank you so much
Hello Sir. When I uchecked my OSM, it does not disappear on my side.
Finally Got It! I had Open Street Map on!
This is an excellent lecture. You really pulled it off. For over 5 years I been wondering how I can work with data files coming as CSV or TXT flat file and you really covered pretty much everything that one need to learn to utilize QGIS to create proper surface dimension modeling as in graduated choropleth map. Lots of Kudos!
Thank you so much!
Thank you
Thank you so much for this video, quite helpful, how do I select multiple countries simultaneously?
Hi.. Hold control and select individual countries.
@@Researchocrat Thanks, I will try that now.
Thanks, but I couldn't extract the shapefile. How do I extract the shapefile, I need it to run an econometric model? Once again, thank you.
Can I have your personal email address, please?
And thank you for mentioning chatGPT, it really helped a lot
thank you for the script!
Very helpful....Thanks a lot
Just subscribed you sir ❤😊
Can we even create waveforms like this ??
Very helpful thank you
TQ so much, god bless me do well in my test tmr hhh
Sir, if we get poor fit, what to do then
It means that your sample size may be inadequate (you need to have more samples), or there is no grouping pattern in your dataset.
@@Researchocrat , kindly make video on pcoa cca and rda also, the way u expalin is very informative,
if we make 1mX1m grid is that accurate?
how to make 1mX1m grid in a selected area
thank you so much for this video
Best explanation❤
Very informative and easy to understand
Thank you for your tutorial, It's very helpfull
Your a great tutor🔥🔥God bless you sir.