
- Видео 72
- Просмотров 182 234
Dean Chereden
Великобритания
Добавлен 26 дек 2020
Hi, I'm Dean... and problem-solving is my thing.
Learning anything new is always overwhelming. Knowing where to start and applying that knowledge to retain it is why most people give up, or even start to learn in the first place.
This is why I set up this channel. My aim is to help people learn by linking the learning of something new to something most people already know i.e. an excel user doing the same task in another program, to get a feel for the new technology.
Executive Time Saving Hack! Power BI in PowerPoint
Having to update PowerPoint slides each month with data can be very time-consuming, and even worse when you update it only for the meeting to be cancelled or moved, so it needs to be updated again and you end up wasting your time updating the first time.
This is where importing Power BI directly into PowerPoint can save so much time, as you can recreate the slides in Power BI, publish them and have the luxury to filter the data any way you want so you can even answer questions in meetings using the same slide, and I’ll show you how easy it is to do in this video.
#PowerBI #DAX #PBICoreVisuals #PowerPoint
▶️ Create KPI cards with Reference Labels
ruclips.net/video/XYJJgwDVVAQ/видео.html
▶️ How ...
Просмотров: 207
Видео


Ultimate Power BI Rolling Averages Guide
Просмотров 480Месяц назад
When working with data it can be hard to see the trend when the period of time causes peaks and lows or compares how the last x days, weeks or months compare to the current day, week or month. This is when rolling averages can help as it can smooth the data to a selected period of time, like the last 7 days or 4 weeks, to understand and compare periods and trends. #PowerBI #DAX #PBICoreVisuals ...

Scrape the web for player market value using RStudio | worldfootballr
Просмотров 992 месяца назад
In this video, I show how to get player market value data using R, both past and present, for all football / soccer players, covering different seasons, and leagues and get their stats and last transfer value too. #rstat #dataanalyst #rstudio 📁 Rscript used in the video data.world/deanchereden/football/workspace/file?filename=Football Market Value - worldfootballr.R ▶️ How to install R and RStu...

This is a GAME CHANGER! Dynamic Switching Metrics in Visuals | Power BI
Просмотров 1,1 тыс.3 месяца назад
I found this amazing trick to update any visual, and any formatting, including conditional formatting and reference labels, when selecting a metric from its core measure using field parameters, and a lot of SWITCH 😀 🚫 Problem I needed to create multiple KPI cards for a KPI Tree but each card had conditional formatting and various reference labels, so setting up just one was very time-consuming....

How to QUICKLY Shade Between 2 Lines in a Line Chart in Power BI
Просмотров 9173 месяца назад
It can be hard to see the difference between 2 trend lines, and if close together even harder if you want to know which is higher or lower. This is where shading between the lines can help and I’ll show how you can shade with lines, or fill the space, and also add dynamic colour change the lines or fill if higher or lower than each other. #PowerBI #DAX #PBICoreVisuals 📁 Dataset for Sales Data a...
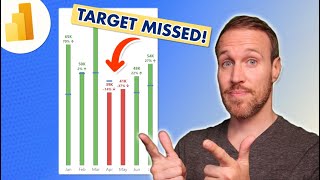
How to EASILY create gauge charts with target lines using standard visuals in Power BI
Просмотров 1,9 тыс.4 месяца назад
Sometimes you need to see how a metric is performing against a target but over a period of time, or categories, in a chart. This is easy to achieve in Power BI using error labels to create target lines in a standard column or bar chart, and you can find out how in this video. #PowerBI #DAX #PBICoreVisuals 📁 Dataset for Sales Data and file for original dim date table M code data.world/deanchered...

WOW with KPI Card Visuals using Reference Labels and Conditional Formatting | Power BI
Просмотров 6 тыс.5 месяцев назад
KPIs are key to monitoring business performance, but in most cases, they do not tell the whole story. This can now be overcome using reference labels and conditional formatting in the new card visual in Power BI and I show you how to maximise them in this video. #powerbi #dax #PBICoreVisuals 📁 Dataset for Sales Data and file for original dim date table M code data.world/deanchereden/superstore-...

Find out what football teams spent in ALL transfer windows using R
Просмотров 915 месяцев назад
In this video, I show how to get transfer data for all football / soccer teams, covering different seasons, and create charts to show off your findings, using worldfootballr. #rstat #dataanalyst #rstudio 📁 Rscript used in the video data.world/deanchereden/football/workspace/file?filename=Football Transfers - worldfootballr.R ▶️ How to install R and RStudio ruclips.net/video/GsiTBOyd7ss/видео.ht...

Find Repeating Customers Using Cohort Analysis | Power BI
Просмотров 1,3 тыс.6 месяцев назад
When understanding customer data, one key area to look at is customer churn/retention to understand which customers/users are returning to purchase again, visit a website or app, or continue a subscription. Cohort analysis gives that insight and more, and I show you how to, using Power Query and a little bit of DAX in this video. #powerbi #dax #powerquery 📁 Dataset for Sales Data and file for o...
Toggle Button TRICK Using Bookmarks & Icons to Switch Visuals | Power BI
Просмотров 2,8 тыс.7 месяцев назад
Users of reports & dashboards generally prefer seeing the same data in different formats, like a table or a chart, & this can mean creating multiple pages to cover every user’s preferred visual.. But what if there was another way? Luckily there is by using bookmarks to switch between different visuals using either the built-in bookmark button or creating your buttons using any icon you wish, an...
EASILY create PIZZA PLOTS for football player stats using R & ggshakeR
Просмотров 6267 месяцев назад
Pizza plots, percentile plots, are a great way to see football / soccer player stats against similar players in the same area, league and compare 2 players. Normally getting the data and setting up the visual can involve many lines of code but with worldfootballr for the data and ggshakeR for the pizza plots, you can easily create them in just a few lines of code and I show you how here. #rstat...
Dynamic LAST & PREVIOUS 12 Months in a Chart and Table | Power BI
Просмотров 7 тыс.8 месяцев назад
One thing I’ve found, in my many years of creating reports in Excel and then Power BI, is when working with monthly reports for clients they were static, as of that month, looking back 12 months and the only way clients could see the previous month's last 12 months was to look at an old report. This is what led me to find a way to change that by creating moving last 12 months based on the month...
How to Conditional Format CALCULATION GROUP Columns in Power BI
Просмотров 3,5 тыс.9 месяцев назад
Calculation groups are a great way to reduce the creation of multiple measures but when you apply conditional formatting, it is applied to all columns! So how do you apply to only the columns you need to conditional format? I’ll show you how & also show how to when using field parameters here: #powerbi #dax #calculationgroups ▶️ Link to how to create the field parameter table shown in this vide...
LEVEL UP your Power BI reporting with R
Просмотров 1,2 тыс.9 месяцев назад
Power BI has come a long way over the last 7 years but there are still areas that it lacks in. Luckily most of these can be done using R directly in Power BI by either the R visual or running an R Script, and one of the best things about this is that in many cases you only need one or few lines of code to get the result you need, and I show you how to in this video. #rstat #powerbi #rstudio #da...
Answer Questions INSTANTLY with a Glossary Page & Info Pop-Ups in Power BI
Просмотров 2,2 тыс.10 месяцев назад
As night is always followed by day, we analysts will always get questions about what things mean in our reports, even if we have explained them in the past. This is why having a glossary / FAQ / data dictionary is key to reducing those questions but also a great aid for you too, as it’s easy to forget all terms or logic on older reports. Also, adding pop-ups, with the same data terms created in...
Save HOURS by Reusing Multiple Measures in Calculation Groups | Power BI
Просмотров 2,9 тыс.11 месяцев назад
Save HOURS by Reusing Multiple Measures in Calculation Groups | Power BI
How to Create Custom Themes in Power BI
Просмотров 2,3 тыс.Год назад
How to Create Custom Themes in Power BI
Create Dumbbell Plots with Callouts in RStudio
Просмотров 302Год назад
Create Dumbbell Plots with Callouts in RStudio
How to get football data for FREE - worldfootballR
Просмотров 4,5 тыс.Год назад
How to get football data for FREE - worldfootballR
Effortless Data Management: List Dates Between using Power Query | Power BI
Просмотров 3,3 тыс.Год назад
Effortless Data Management: List Dates Between using Power Query | Power BI
How to CONVERT JSON string file to CSV in RStudio
Просмотров 1,1 тыс.Год назад
How to CONVERT JSON string file to CSV in RStudio
The ULTIMATE Append Hacks in Power Query | Power BI
Просмотров 1,3 тыс.Год назад
The ULTIMATE Append Hacks in Power Query | Power BI
How To Create An ANIMATED Bar Chart Race
Просмотров 1,2 тыс.Год назад
How To Create An ANIMATED Bar Chart Race
Find 'BEST PERFORMING' products with a Pareto Chart (80/20 Rule) | Power BI
Просмотров 9 тыс.Год назад
Find 'BEST PERFORMING' products with a Pareto Chart (80/20 Rule) | Power BI
🔽 Convert a string JSON file in just a FEW CLICKS 🖱️ using Power Query | Power BI
Просмотров 1,1 тыс.Год назад
🔽 Convert a string JSON file in just a FEW CLICKS 🖱️ using Power Query | Power BI
How to Calculate Mean, Median & Mode in Power BI using DAX | Statistics: Central Tendency
Просмотров 8 тыс.Год назад
How to Calculate Mean, Median & Mode in Power BI using DAX | Statistics: Central Tendency
Unlock Infinite API Data Requests - Leverage the Power of For Loop in RStudio
Просмотров 640Год назад
Unlock Infinite API Data Requests - Leverage the Power of For Loop in RStudio
How to create MULTIPLE GRAPHS by GROUP in RStudio using Facet Wrap & Facet Grid
Просмотров 837Год назад
How to create MULTIPLE GRAPHS by GROUP in RStudio using Facet Wrap & Facet Grid