
- Видео 13
- Просмотров 92 926
Py: ZIS
Непал
Добавлен 1 окт 2018
How to use 'Downloaded SVG Images' for a symbology in QGIS? #QGIS #symbology #SVG #GIS
This video is a short one and in this video, the main intention is to let the viewers know about the minor change we need to do in the QGIS settings to include our folder in the SVG browser within the QGIS Symbology properties.
Просмотров: 1 495
Видео
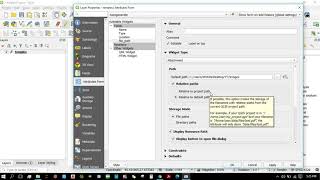

Addition of Images/Photos as an attribute of a shapefile in QGIS #QGIS #Images
Просмотров 17 тыс.3 года назад
1)Add the shapefile. 2)Toggle editing. 3)Add new field (type=text). 4)Open properties of shp. 5)Go to attribute forms and set the widget type as an attachment. 6)Provide default path(NOT A NECESSARY STEP) 7)Check on 'Display resources path' and 'Display button to open file dialog'. 8)Set document viewer as an image. 9)Click 'OK' and close. 10)Click on 'Identify features', click on the point and...

Visualisation of flow directions using 'Arrow' symbols #Qgis #FlowDirection
Просмотров 9 тыс.3 года назад
Visualisation of flow directions using 'Arrow' symbols #Qgis #FlowDirection

Creating Thiessen Polygons for a catchment (in QGIS) #qgis #thiessen #voronoi
Просмотров 13 тыс.4 года назад
In this video, we create Thiessen polygons (Voronoi polygons) for a catchment using the sets of rainfall stations provided.

Preparation of basin model from the terrain datasets (DEM) in HEC-HMS 4.5 #hec-hms
Просмотров 14 тыс.4 года назад
1)Open HEC-HMS. 2)Create a new project. 3)Go to Components→Terrain Data Manager and load the digital elevation model (DEM). 4)Go to Components→Basin Model Manager→Create New Basin→Add Terrain to the basin (Skipping causes the program to adopt the projection of terrain data set.) [Sometimes, the terrain might not be displayed properly on the screen although the data is there. This might have hap...

LandsatLook Natural Color Image in QGIS (By building a virtual raster) #QGIS #VirtualRaster
Просмотров 3,4 тыс.4 года назад
In this video, we'll create a LandsatLook Natural Color Image in QGIS by building a Virtual Raster. I'm going to use Landsat 4 data for an example. You can use other Landsat data as well. The band combinations is going to be different depending upon the Landsat data you have but the process is same for all. For building virtual rasters, Raster Misc Build Virtual Raster Make sure that the input ...

OSMDownloader Plugin and XYZ Tiles in QGIS #QGIS #XYZTiles #OSM
Просмотров 2 тыс.4 года назад
1)Download and install the OSMDownloader plugin in QGIS. . 2)Add google map layers through XYZ Connection. Use the links like the following ones. You can easily find these in google. (Use the suitable ones.) Roadmap: mt0.google.com/vt/lyrs=m&hl=en&x={x}&y={y}&z={z} Hybrid mt0.google.com/vt/lyrs=y&hl=en&x={x}&y={y}&z={z} Terrain mt0.google.com/vt/lyrs=p&hl=en&x={x}&y={y}&z={z} 3)Open the OSMDown...

Cross Sections from Contours in AutoCAD (Using SW DTM) #CrossSections #Contours #SWDTM
Просмотров 21 тыс.4 года назад
SW DTM: softwel.com.np/download_software STEPS: 1)Open your contour in AutoCAD. 2)Check the layer of your contours. 3)Draw the alignment in different layer or import it. 4)Open SWDTM. 5)Process the contour. While processing, make sure that you choose the correct layer used for contours for processing. 6)Triangulate. 7)Click on 'X-section' and then on sections by DTM. 8)Enter the values of Start...
![Contour Interpolation: [From a contour of one interval to that of another interval] #SWDTM #AutoCAD](/img/1.gif)
Contour Interpolation: [From a contour of one interval to that of another interval] #SWDTM #AutoCAD
Просмотров 1,9 тыс.4 года назад
SW_DTM: softwel.com.np/download_software MUSIC: ruclips.net/video/hqPJY0hIpxk/видео.html
Getting Started with HEC-HMS: Muskingum Routing Method #HECHMS #Routing #Muskingum
Просмотров 1,8 тыс.4 года назад
In this video, we'll learn about the basics of HEC-HMS. And for that, we'll do Muskingum Routing Method. HEC=Hydrologic Engineering Center HMS=Hydrologic Modelling System 1)Open HEC-HMS. 2)Click on 'File' and then New'. And give suitable name and location path. 3)BASIN MODEL MANAGER: i)Click on 'Components' 'Basin Model Manager' 'New'. ii)Click on 'Basin Model' and then on Basin that we just cr...
An example of working with graphical modeler in QGIS: MCDM model #QGIS #GraphicalModeler
Просмотров 1,7 тыс.4 года назад
This video will demonstrate an example of modeler in QGIS. For an example of modeler in QGIS, we'll create a MCDM (Multi-Criteria Decision Making) model to find areas suitable for paddy cultivation. We'll use soil data, landuse data and slope (slope will be generated from the DEM). In an attribute table of these shapefiles, the field for suitability values for all features is present in which t...
Reservoir Volume Calculation Using Raster Calculator #QGIS #RasterCalculator
Просмотров 3,8 тыс.4 года назад
There are numerous softwares and methods to calculate the volume of a reservoir. The method demonstrated in the video is one of the simplest and fastest method to get the approximate volume of the reservoir.
Using Autodesk AutoCAD Map 3D to convert contour shape files into dwg files
Просмотров 1,4 тыс.4 года назад
There are many ways to convert a shapefile into its dwg format and this video is about using AutoCAD Map 3D to do so. Just importing a shapefile into the map 3D won't help. There are few steps to consider for the meaningful conversion.
sorry teacher fo me it not working the result is name of path not show image can someone help me thankyou
If we want a lof of images for 1 point ?
Inaudible 😢
It is possible to add multiple pictures with different title for one shape files
Ic mn 1 feet 10 inch ka show ho rhaa ha
I get nothing when I am preprocess sinks. Any solution?
Please elaborate the problem. Do you mean like you get no output even after the processing or do you mean the output is same as the DEM? There might have been the layers generated but not displayed. Check in the layers.
@@pyzis I got the same problem: layers Flow accumulation, Flow Direction, Sink locations, Sink fill are created but empty :(
How to make value of flow direction?
Sorry for the late reply. You can use your DEM to generate the flow direction files. First fill the DEM and compute the flow directions. There should be tools called "Fill" and "Flow direction".
Hi. Thank you for the video. I would like to ask what I can to obtain natural look rasters for hematite dust
you saved my day man! I gave you a like! Thank you!
Great! Do you have the steps to make a flow direction?
You can use two of the GIS tools in conjunction. First fill the dem using the "fill" tool and then, there should be another tool called "flow direction" .
Excellently done!
Interesting! Good job!!
Great!!!
Thanks sir
This is what I was looking for. Thank you 🙌🏻
thanks for the tutorial, this is really helpful for my college task 👍
Terrain data manager is not created Even selection of tif file of dem
Hello doctor, please how can I create a DEM elevation model file from the surface of the image surface using the Qgis orfeo toolbox plugin please tell me the steps
Exactly what I was looking for, this was very helpful. Thanks you, sir!
Glad it was helpful!
How to represent by color, when I have a group with several symbols in the same direction? If I have several arrows in a region pointing north, this indicates a greater relevance of runoff.
Can you do it on a basemap?
Yeah, You can overlay these points over the basemap if that's what you mean.
❤❤
Most useful video♥️
How to use power point diagram in svg
If you're talking about using built-in PowerPoint blocks or symbols for symbology, you can first save it to your device and for that, select it and save it as picture. You can directly save it as SVG too but I'm not sure if you can save it as SVG in older versions of PowerPoint. Even if older versions of PowerPoint doesn't allow direct save to SVG, you can use multiple websites to convert those image files into SVG. Adobe express allows you free conversion from PNG to SVG file types.
Thanks, this was helpful
THANKSSSSSSSS!
Thank you. How do you create the "struture" for your dam?
Thank You so much
If large size file is not open? Then what to do
if i have multiple geo tiff data sets, is there a way to combine them into one basin model?
You can use GIS to merge those files.
excelent
Thank you for your good information
EXCELLENT ONE JI
thanks, that is handy
great work but when i Export it into Geojson why its not show me the image ? or its just work with shapefile?
The images are not actually stored in the attribute table of the shapefile, only the filepaths are stored which is then utilised to display the image. Also in GeoJson, the image attributes can be stored as a file path string but not as a direct image. At the end of the day, you need an image viewer to display the images.
Jab cross section swdtm say plot hota hai uska scale mai nahi aata kyo
Nice video. But such a wastage of time shifting from HEC hms to notepad so many times. What was the need for that !! 🤔
To clearly demonstrate the required steps.. I thought it was very effective.
thank you , needed this much
was waiting for this 😁🤓
Very well explained!
I was waiting for this 👏
I was needing this explanation, thanks a lot!
Glad it was helpful!
Hi, Can you please tell me how and from where I can get this DEM data for a specific location? I have been trying to get this DEM but no success
You can download it from the official website of USGS or from opentopography.org or from any other websites. There are many sources for the data.
could not delineate elenents because the break points did not intersectthe stream network in hec hms ???
How should we select the value for - area to define streams? some random value or any guidelines?
Well it depends on how you want your river network. Just a main river or tributaries as well.
@@pyzis I need River as well as major triburaries. Any suggestions?
@@navin8112 I'd say approach it like a trial and error or if you have a river network shapefiles, you can use that as well.
@@pyzis yeah. I have a shape file. Thank you so much
when make break point give me messgae break point did not intersect the stream network
Sorry for replying very late. You could zoom in a little bit and try. Or try importing an outlet shapefile.
Great channel, looking forward to seeing more uploads! This deserves more views, I think you should use smzeus . c o m to increase your social proof!
really helpful!!🧡
hello sir. ..u r frm nepal right? can i ask u few questions on hec hms? i have a lot of doubts before starting my project.. can u help me?
Bro, I don't have much experience with hec-hms. I learned it like last year matra for my college assignment. But vannus na, I'll try to help sakdo.
@@pyzis i am finding difficulty in estimating the initial values such as k and x for rivers, and other values such as baseflow (which to select and why?, how to estimate the initial values if i am choosing constant monthlt baseflow method ,, and so on.. how can i get a starting value before i even think of optimizing by comparing with the observed values?)
Normally, X ranges from 0 to 0.3 for natural rivers and K being the travel time, depends upon the reach. Just assume suitable numbers for your reach and try optimization trial manager in hec-hms. It'll help you to get optimised value of K and X. You can do trial and error with it and tune it within the suitable range of K and X. But make sure that the optimisation doesn't give you an absurd value. And when it comes to baseflow method, it depends on many factors like if the conservation of mass in a sub-basin is a must or not, what the purpose of model is, etc.
Thank you for watching.😊