
- Видео 6
- Просмотров 106 644
Peeling Back Data
Австралия
Добавлен 17 авг 2020
Hey everyone!
Welcome to my channel focused on tutorial videos for R data analysis and data science. I have over 5 years experience coding in R, and have a strong passion to share my skills that I have learnt. Feel free to leave a comment for any future suggestions or improvements that you have for the channel as I am trying to grow! I hope you enjoy the content!
Welcome to my channel focused on tutorial videos for R data analysis and data science. I have over 5 years experience coding in R, and have a strong passion to share my skills that I have learnt. Feel free to leave a comment for any future suggestions or improvements that you have for the channel as I am trying to grow! I hope you enjoy the content!
Error Codes when using ggplot in R (And how to fix them)
A short video outlining 7 common mistakes/error codes when using ggplot in R. The code used in this video can be found on the following link: 1drv.ms/u/s!AjV0z-feoMBLhesdJ4FFL9GFuYfJEw
See the timestamps below:
0:00 - 1. Colour (or other options) within aesthetics gives unexpected results
1:38 - 2. Error: "Continuous value supplied to discrete scale"
3:16 - 3. Error: "invalid argument to unary operator"
4:14 - 4. Error: "stat_count() can only have an x or y aesthetic"
5:09 - 5. Discrete value not as factor when on x-axis
5:51 - 6. Error: "Insufficient values in manual scale. y needed but only x provided."
7:01 - 7. Error: [geom] requires the following missing aesthetics: x and y...
Просмотров: 3 172
Видео


Multi-Panel Plots in R (using ggplot2)
Просмотров 39 тыс.3 года назад
Hi everyone, this video discusses how to create multi-panel plots in ggplot2 as well as combine multiple plots into one figure using ggarrange. There is also a bonus section at the end addressing a question in the comments, which explains how to create a graph with more than one trend line and a matching numbers of legends. Please find the timestamps listed below: 0:00 - Introduction 0:09 - Mul...

Scatter plot and Line plot in R (using ggplot2)
Просмотров 44 тыс.4 года назад
In depth video looking at how to draw scatter plots and line plots in R, as well as other graphs such as bubble plots. The R file used in this video can be found here: 1drv.ms/u/s!AjV0z-feoMBLhOMCfK2ZJeBVD1SaJA?e=ZKWJRr. The geoms used in this video, and in order of use, are: geom_point(), geom_abline(), geom_smooth(), geom_hline(), geom_vline(), geom_jitter(), geom_violin(), and geom_line(). S...
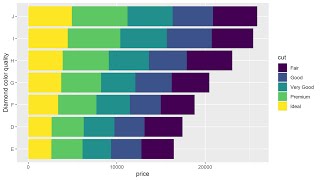
Bar and Column Graphs in R (using ggplot2)
Просмотров 10 тыс.4 года назад
This is the second lecture in the course 'Graphical and Visual Analysis in R' and guides you how to perform basic and complex bar charts in R using ggplot2. The time stamps for each section are: 00:00 Introduction and Basic Bar Plot 02:36 General Bar Plot 05:12 Geom_col, and how it’s very similar to geom_bar() 07:33 Tweaking your bar plot 11:15 Adding Error Bars (geom_errorbar)

Introduction to ggplot in R
Просмотров 9 тыс.4 года назад
This video provides a comprehensive introductory guide to ggplot in R, with step-by-step instructions to create a Scatter Plot and Boxplot. Please find below the link to the R file used in this video: 1drv.ms/u/s!AjV0z-feoMBLhNxFALjiIbItQD_Epg?e=bQ6Nx3

Channel Overview and What We Will Teach
Просмотров 1964 года назад
An introduction to what our channel will be about. We hope this intrigues you, and that you become motivated to learn more about R and data science! Subscribe to watch our upcoming videos!
I have been watchin 5+ hours of tutorials, you are the only one that taught how to get the equation. So... in a nutshell YOU rock!
Question> is there a way to infer the equation directly from geom_smooth outputs?
Hi I love your series and am waiting for you to hopefully release your much anticipated machine learning videos
thanks for fixing all 7 of the errors I encountered, unreasonably based video
this was so easy to follow, I wish you were my lecturer gg I rate this 9/10 bananas
thank you so much, I got a job in data science thanks to this liked and subscribed
this content makes me bananas in the good way
best intro this side of youtube, thank you
cannot wait to feast on this absolute content
Top shelf stuff!
thank you for your help ..
If I have replicates, how to deal with that?
Great video! Very easy to understand and follow. Thanks for sharing!
how to use ggarrange in a for loop
Very helpful tute buddy thank you from Saudi Arabia
tengo que instalar el paquete ggarrange? me dice que no encuentra la función con ggplot2
thanks you are a great teacher
nossa, muito dificil de entender o código.. se tivesse separado por argumento seria mais fácil.. claro que o código funciona assim, mas não é facilmente lido por nós humanos
I am using Rstudio 4.2.1 every time I am searching for the library ("diamonds"); it shows that "Error in the library("diamonds") : there is no package called ‘diamonds’". Please help me to solve this...
Diamonds dataset is a part of the ggplot2 package. I guess, you tried to open the Diamonds dataset before installing/loading the ggplot2 package? Try this: 1. Type the code and run it: install.packages(“ggplot2”) 2. Load the ggplot library: library(ggplot2) 3. Load the dataset: data(“diamonds”)
Hi guys, I am coding with R. My code worked untill yestarday. Today I'm getting the following error: "error in ggplot could not find function "ggplot"", please someone help me to fix this? Thanks a lot.
Thanks for the clear explanation about ggplot
thank you so much
thank you so much..
Excelente video amigo, felicitaciones y gracias por compartir
Nice
Where is your normality testing? You can't draw any conclusions without it boe. I suggest you study statistics on higher level, and then make this video again.
This video is on visualisations not normality testing. Read the title buddy:)
Thank you so much, could you send the csv file and code
Interesting video! can I get the syntax?
Nothing is working, ggarrange() is not even a function in the ggplo2 package, you need to install ggpubr, and even then you still cant use ggarrage(). And what about multi panel plot 2 plots of any type? not just ggplots, this is not usefull, and you dont even explain what the functions do.
Yeah read a book buddy
Thank you for nice lab,
I really don't get why when I use the fill=color, i get an error: Error in FUN(X[[i]], ...) : object 'colour' not found Also with a bigger dataset the y axis sets a maximum of 2000. So I don't see the full graph.
Hey! I was able to replicate the error you got using the code "ggplot(diamonds) + geom_point(aes(fill = colour))", so I think you may have just spelt it as 'colour' rather than the american way which it is written in the dataset. This error can also happen if you don't call the dataset and write "ggplot() + geom_point(aes(fill = color))" For the second part of your question, I don't think I have ever noticed the y-axis setting a maximum. However, the axis limits can be changed by adding 'scale_y_continuous(limits = c(desired_minimum, desired_maximum))'. For example, you might add '+ scale_y_continuous(limits = c(0, 20000))' to your ggplot code. I hope this helps!
@@peelingbackdata3907 thanks a lot! This helps
Thank you for sharing this! That helps me a lot in creating beautiful graphs for my project. Keep up the great work!
thank you for this. what if I have more than 100 products and want to visualise their sales to pick on any apparent trend???
Thank you very much. This is really helpful.
you are such a great lecturer! ive watched 2 of your videos and you are brilliant and is so easy to understand you!!!
Thank you so much! I will try to create more videos soon!
Can we get the code? Thanks much!
Hi, nice vid! But I’m still a bit confused on the subsetting the diamonds data.... what is it used for?
Hi, glad you enjoyed the video! I just decided to subset the diamonds data so that it was easier to work with and demonstrate these techniques. When there are less data points the plots load much quicker, and seeing some of the trends is a bit easier I find. On a real-world dataset I wouldn’t recommend subsetting it unless you had a good reason to.
Hi, this is amazing video. I tried and successfully made initial graph. I am unable to relate If we have time steps values .. I mean How can we make panel data graphs following the same steps? I have data for 1000 time steps values of 150 agents. As total of 150 (small, medium and large )farmers with distance from water source use surface water over the period of 1000 steps. How to see effect of time in it? Please guide!
Your content is good. Please post more videos on R concepts. It's a very good and coceptual video that helped me to clear my doubts and gain knowledge about the barplots.
Thank you so much! That really means a lot. I keep meaning to post more videos, but hopefully I will find the motivation to post another one this week!
This is so useful thanks
Thank you.It is rewarding watching your video and God bless you very richly.
Thank you, that’s very kind!
Awesome, thank you!
Helpful video. One thing that sort of confused me was that I initially thought that the ggarrange() function was part of ggplot2 when it rather is a function of the ggpubr package. It is my first time hearing about that package and I know that may be the case with others who come to this video. Thanks for sharing this.
Hey thank you so much for pointing this out! I will try to update it so that it’s clear that you need to have the ggpubr package installed.
Thanks for pointing this out!
Thank you so much for the video! It really helped me!
All good, Glad I could help!
Great work
Thank you! I am going to be releasing another video soon so keep an eye out for it.
Hello, thank you for video. But the package ‘ggpmisc’ is not available. How to install it?
Hi, thanks for watching the video! You should be able to install it using the command 'install.packages(ggpmisc)'. In my video "Introduction to ggplot in R" I discuss how to install a package if you want to look at that (about 35 seconds into the video).
@@peelingbackdata3907 thanks a lot!
@@peelingbackdata3907 could you please explain or do a video how to create two curves with correlation coefficient in one graph, in this video only one. If it is possible with p-value would be great! Thank you!
@@shohnazarhazratqulov6731 Hi yeah sure I would be happy to explain that! I will feature that at the end of my next video (which I should have out by the end of tomorrow).
@@peelingbackdata3907 Thank you, I have already created two linear lines in one graph, but after calculating R>2 (correlation coefficient) the legend of ggplot is deleted , please explain how to do legend with (or after) calculating of R>2, and separate R>2 for each linear lines
ty subbed
hello .
Hi!
Thank you tycho for all the information you have given me
In later videos, Tycho will address a wider range of topics which should be of interest to you. Stay tuned!
thank you so much
That's okay! Glad I could help!
Looks great my dude! Currently trying to figure out Python but when I get back around to exploring R more I can tell this will be great! Keep up the great work!
Thank you so much! We will keep trying to improve things (like the audio quality) but I am really glad you are enjoying it so far!