
- Видео 75
- Просмотров 237 869
Milos Makes Maps
Нидерланды
Добавлен 6 авг 2011
I paint the world with R and teach you how to unleash your inner map artist. Join my map adventures and tutorials now!
Download, set up and customize Positron for R on Windows 11
In this video, you'll learn how to download, set up, and customize Positron, the latest integrated development environment (IDE) that seamlessly integrates native R and Python kernels into the VSCode environment. We will kick off today's adventure by downloading and installing R, RTools, and Positron as well as customizing your settings in this brand-new IDE. Perfect for data scientists and developers looking to streamline their workflow! 🖥️✨
Chapters
0:00 Intro
00:29 What is Positron?
00:51 What does Positron bring?
01:52 Download R
02:08 Install R
02:33 Download RTools
02:56 Install RTools
03:31 Download Positron
04:01 Install Positron
04:29 Inside Positron
05:35 Running code in Positron
06:49 Custo...
Chapters
0:00 Intro
00:29 What is Positron?
00:51 What does Positron bring?
01:52 Download R
02:08 Install R
02:33 Download RTools
02:56 Install RTools
03:31 Download Positron
04:01 Install Positron
04:29 Inside Positron
05:35 Running code in Positron
06:49 Custo...
Просмотров: 2 095
Видео
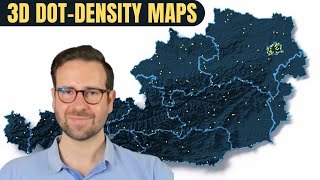

Mastering Dot Density Maps in R: Population Insights Unleashed
Просмотров 1,3 тыс.2 месяца назад
Today, we're diving into the fascinating world of dot density maps. Dot density maps are like sprinkling magic dots across a map to reveal hidden patterns. Each dot represents a specific number of occurrences of something cool-like population, housing density, or even crime rates. In today's tutorial, we'll roll up our sleeves and create 2D and 3D dot density maps using R, ggplot2, and rayshade...
![Install R and RStudio on Windows 11 - A Simple Guide [2024]](http://i.ytimg.com/vi/HzGVz8ju3W8/mqdefault.jpg)
Install R and RStudio on Windows 11 - A Simple Guide [2024]
Просмотров 2,1 тыс.2 месяца назад
This video is your straightforward guide to installing R and RStudio on your computer. I'll show you how to set everything up, configure RStudio, and get the essential packages for GIS and data analysis. Follow these three easy steps, and you'll be ready to tackle data science projects in no time. Let's get started! Chapters 0:00 Intro 00:14 STEP 1: Download and install R 02:30 STEP 2: Download...

Creating Temperature Anomaly Maps in R: A Guide Using NASA Data and Multiple Projections
Просмотров 1,2 тыс.3 месяца назад
In this tutorial, you'll learn how to use NASA's gridded surface air temperature anomaly data to create detailed monthly and yearly maps in R. We'll cover how to reproject the data into different map projections, including Robinson and Orthographic, and how to visualize it using ggplot2. This guide is perfect for anyone interested in climate data or mapping in R. Check the full code in my GitHu...

Visualize Like a Pro: 3D Elevation and River Maps Made Simple
Просмотров 4,8 тыс.3 месяца назад
Explore the capabilities of the `rayshader` package in R with my new tutorial. I'll guide you through the process of creating detailed 3D elevation and river maps for any country. This step-by-step tutorial is perfect for anyone looking to enhance their mapping skills with powerful visualization tools. 🌍🖥️ Check the full code in my GitHub repo: github.com/milos-agathon/3d-river-maps Follow my w...

Create stunning tree height maps with Meta & World Resources Institute Data
Просмотров 1,6 тыс.3 месяца назад
In this tutorial, I'll guide you through the process of downloading the latest tree canopy height data from Meta and the World Resources Institute, with a detailed resolution of 1 meter. You'll learn how to create clear static maps using ggplot2 in both light and dark themes, as well as interactive maps with leaflet. This step-by-step guide is perfect for anyone interested in enhancing their ma...

Sail the Data Sea: Charting the World's Shipping Lanes with R 🚢⚓️📊
Просмотров 8544 месяца назад
In this tutorial, we'll explore how to utilize data from the World Bank and IMF on global shipping traffic, along with EOG VIIRS nightlight data. You'll learn to create clear and detailed maps for any region worldwide using ggplot2 in R. This guide is ideal for those interested in data visualization and geographic mapping. Check the full code in my GitHub repo: github.com/milos-agathon/shipping...
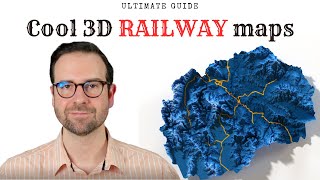
3D railway and elevation maps using rayshader in R
Просмотров 1,1 тыс.5 месяцев назад
3D railway and elevation maps using rayshader in R

Mapping ESA Global Land Cover Data via Microsoft Planetary Computer STAC API
Просмотров 7565 месяцев назад
Welcome to today's tutorial, where we explore the varied landscapes of our planet through ESA's advanced satellite data. Using Microsoft's Planetary Computer STAC API, we'll delve into mapping Earth's land cover with the programming language R. From green forests to urban areas, join us as we reveal the details of our planet's surface. Remember to subscribe for more insights into the world of E...
From Honks to Maps: Traffic Noise Mapping Mastery with R!
Просмотров 7125 месяцев назад
Today's tutorial offers a comprehensive guide on utilizing the European Environmental Agency's traffic noise data. We will demonstrate how to calculate noise levels for major roads and illustrate the process of creating informative noise maps using R. Check the full code in my GitHub repo: github.com/milos-agathon/traffic-noise-maps Follow my work on Instagram: milos_makes_maps Le...
Create Eye-Catching 3D Elevation Maps with a Sleek Inset Map
Просмотров 1,6 тыс.5 месяцев назад
In today's tutorial, we're diving deep into the realm of 3D elevation maps with inset maps, also known as study area maps. We'll harness the power of ggplot2 and rayshader in R to transform your data into stunning, high-definition 3D landscapes. Check the full code in my GitHub repo: github.com/milos-agathon/3d-elevation-inset-maps Follow my work on Instagram: milos_makes_maps Let...
How to Create Amazing Precipitation Maps with R in 2D and 3D
Просмотров 2,6 тыс.5 месяцев назад
Do you want to create stunning precipitation maps with R? 🌧️ In this tutorial, I'll show you how to use the pRecipe package to access and analyze one of the 27 available precipitation datasets. You'll learn how to: - Download the MSWEP data, which covers the entire globe with high spatial and temporal resolution - Compute the average precipitation for any location and time period of your intere...
How to Turn Flight Route Data into Beautiful Network Visualizations with R
Просмотров 8966 месяцев назад
Do you want to see how flights connect the US in a beautiful network visualization? 🛫 In this tutorial, I’ll show you how to get US flight data, calculate flight routes and make stunning network visualizations of flight routes with R. 🌎 You’ll learn how to use the ggraph package in R and its edge path bundling algorithm to create the shortest flight paths. 🛬 Check the full code in my GitHub rep...
The Amazing World of Cartograms: Mapping Agricultural GDP
Просмотров 7456 месяцев назад
In this video, I will show you how to make awesome cartogram maps of agricultural GDP using R and ggplot2. You will learn how to use the World Bank’s AgGDP and GHSL population data to get the agricultural GDP per capita for any country in the world. You will also learn how to use ggplot2 to create cartograms that adjust the size of countries based on their farming value. Check the full code in ...
The Ultimate Guide to R-ArcGIS Connection and NDVI Mapping
Просмотров 2 тыс.6 месяцев назад
In this tutorial, we are going to explore the amazing power of the R-ArcGIS connection. You will discover how to use R to access the vast ArcGIS database and create stunning NDVI maps with the awesome ggplot2 and rayshader packages. Don't miss this chance to learn how to combine the best of both worlds: R and ArcGIS! 🌎🌱🌿🌳 Check the full code in my GitHub repo: github.com/milos-agathon/arcgis-in...
How to Create Amazing Eurostat Maps in 2024 with R and ggplot2
Просмотров 1,8 тыс.6 месяцев назад
How to Create Amazing Eurostat Maps in 2024 with R and ggplot2
3D elevation and urban area maps with R
Просмотров 3,6 тыс.7 месяцев назад
3D elevation and urban area maps with R
How to Make a Sex Ratio Map with Meta’s Data for Good in R
Просмотров 9867 месяцев назад
How to Make a Sex Ratio Map with Meta’s Data for Good in R
Learn to Make 3D Maps with Light Bubbles using rayshader in R
Просмотров 9727 месяцев назад
Learn to Make 3D Maps with Light Bubbles using rayshader in R
Mapping Carbon Emissions Per Capita with R
Просмотров 1,8 тыс.7 месяцев назад
Mapping Carbon Emissions Per Capita with R
How to Make Amazing 3D Vintage Topo Maps
Просмотров 3,1 тыс.8 месяцев назад
How to Make Amazing 3D Vintage Topo Maps
How to Find the Shortest Path on a Map
Просмотров 1,4 тыс.8 месяцев назад
How to Find the Shortest Path on a Map
Unleash the Power of 3D: Crafting Stunning Land Cover Maps with R
Просмотров 20 тыс.8 месяцев назад
Unleash the Power of 3D: Crafting Stunning Land Cover Maps with R
How to Create Stunning 3D Population Maps with deck.gl in R (Easy and Fun!)
Просмотров 2,2 тыс.9 месяцев назад
How to Create Stunning 3D Population Maps with deck.gl in R (Easy and Fun!)
Create Stunning 3D River Basins in R using HydroSHEDS Data and rayshader
Просмотров 8 тыс.9 месяцев назад
Create Stunning 3D River Basins in R using HydroSHEDS Data and rayshader
How to set up Google Earth Engine in R and Create Amazing Earthquake Maps [2023]
Просмотров 4,9 тыс.9 месяцев назад
How to set up Google Earth Engine in R and Create Amazing Earthquake Maps [2023]
How to map population Change GHSL Data in R [2024]
Просмотров 7 тыс.9 месяцев назад
How to map population Change GHSL Data in R [2024]
How to Build a 3D City from Scratch with LiDAR Data
Просмотров 2,2 тыс.10 месяцев назад
How to Build a 3D City from Scratch with LiDAR Data
can this be done in javascript?
No idea 😁
The BEST VIDEO. I'm stuck on languageserversetup::languageserver_install() . I have an error, File name issue. Too long Ant solution? Please 🙏🏻
Hola Milo, te saludo desde Argentina, excelente tutorial, gracias, te hago una consulta, el archivo "air_museum_playground_4k.hdr" como se genera? Con que programa lo hiciste? Cómo puedo hacerlo para replicar tu tutorial para un área diferente. Gracias! Ceci.
Que gran tutorial.-
Hey Milos can i do this for state level or district level.
Hey Gaurav, absolutely, you would just need to load your custom shapefile using st_read from sf package
@@milos-makes-maps ok Thank you
Heyy, you're an inspiration! But i have a question, I have everything the same as you and it tells me "Error: object 'out_dir_macedonia' not found" :c
Thank you so much Diana! The error suggests that you didn't create this directory. Check if you ran all the lines, where the error occurs in the code and let me know if it works
Milos thank you so much for this tutorial, it provides great insights and perspectives! I wrote to you on IG a while back too. I was wondering if you could help me debug have installed version 3.3.6 of ggplot2 as you recommended, everything goes smoothly to map forest height of Socotra island until step #7 where I get the following error message: Error in check_inherits(layout, "Layout") : could not find function "check_inherits" I suspect this has to do with something in the ggplot function (and therefore in ggplot2 version 3.3.6.) since there is no other function named "check_inherits"? Thanks a lot in advance for your comments in case you come along here to check the comments on this great tutorial (and all the others!)!
Hey Milos! I have been trying this for a whole day but the datas i am downloading from Esri Living atlas, are showing to be single banded. Why this? I have tried like 100 times! But it says the same. Thats why didnt get any result at last! It was just a plain blank map! Please help me.
Sir please where did u go to, to inspect the raster file at 6:16
Hello, you just need to mark the raster object name and execute that piece of code
Great work Milos! I have just a suggestion to simplify the creation of the bounding box. We can use the "ext" function from the terra package, which creates a SpatExtent object directly from the bounding box coordinates. # Get bounding box for Istanbul city <- "Istanbul, Turkey" istanbul_border <- osmdata::getbb(city) # Create a SpatExtent object using the bounding box coordinates for Istanbul ext_istanbul <- terra::ext( istanbul_border[[1]], # min longitude istanbul_border[[3]], # max longitude istanbul_border[[2]], # min latitude istanbul_border[[4]] # max latitude ) This SpatExtent object can be used later to crop or mask SpatRaster objects
Thank you for your fantastic contribution, Gustavo! I pinned your comment so that others can see and implement your great suggestion
And IRAN please.
hi, I'm doing a land cover map for Serbia and I'm stuck at 15:34 mark, where my min and max values are 1.000000 and 1.000008 respectively. I've been using chatgpt to troubleshoot my issue for 2 hours now but with no luck at all. what could be the issue?
Hi, try updating the terra package to the latest version, then restart your R session and try again. This has already helped a few users
@@milos-makes-maps Thank you!
Hi Milos, thanks for an amazing tutorial. I have a query, 1. how do I upload data from local drive 2. I do get an error as "Stamen map tiles are now hosted by Stadia Maps" , how can I choose other map
Thanks for sharing this. It is really an amazing, I'm I'll get a lot of work done there. However, from my first glance, I really have the feeling that RStudio views plots somehow better. Also, I've tried to render a Quarto notebook and it seems to try execution with R 4.3.2. But I've 4.4.0 installed. Below is the error message: PS C:\Users\visne\Desktop\myRProject> quarto preview c:/Users/visne/Desktop/myRProject/Quarto.qmd --to docx --no-browser --no-watch-inputs ERROR: Error executing 'C:\Program Files\R\R-4.3.2\bin\Rscript': The system cannot find the file specified. (os error 2) Unable to locate an installed version of R. Install R from cloud.r-project.org/ PS C:\Users\visne\Desktop\myRProject> Please any idea?
Oh, I solved the issue. I went to the directory C:\Program Files\R and I saw a folder R 4.3.2, probably the former version I uninstalled, in addition of my current version R 4.4.0. So I deleted the folder R 4.3.2, restarted Positron and had to install again yaml, rmarkdown, and knitr packages for a reason I don't understand well. It's now working! :)
Thank you for showing us positron. I appreciate your guidance.
Have you ever used things like github codespaces? Where you can spin up a VSCode environment to work on your code all from within a browser? Wouldn't it be great if you could have a github codespace that fired up Positron?
What I lack as a data visualisation specialist is exporting option from window as it is in RStudio. As it let's you resize the plot and preview it before exporting, that is essential for me, almost a dealbreaker. Do you know any extension that would do the same in Positron?
I understand how crucial that feature is for your workflow. While Positron is still in its early stages, several potential ways to achieve similar functionality come to my mind. 1. Quarto Extension: - Install the Quarto extension for Positron. It allows you to render Quarto projects and preview them, similar to how you would in RStudio. 2. httpgd Package - Use the httpgd package in R, which provides an interactive web-based graphics device. You can resize and preview plots in your browser before exporting them. 3. VSCode Extensions: - Explore VSCode extensions like Plotly or Vega Viewer for interactive plotting and exporting options. These extensions can offer enhanced visualization capabilities within Positron.
@@milos-makes-maps Speak of the devil, I just checked and it seems they have already integrated that functionality and it's even better than in RStudio. Check it for yourself. No need of the extensions. Thank you for the detailed answer.
@@IrakliKavtaradzepsyche Great find, will check it out!
@@milos-makes-maps Is it possible to use VSCode Extensions within Positron?
@@PassingTheDogYes but not all. For example Github Copilot cannot be used in Positron for licensing reasons
Thank you very much for the settings advice. I really liked the git integration with Positron. Great video!
Thank you for your kind words! And happy coding in Positron
great stuff, does this mean we can run R and Python in the same file (say in a Quarto Document) in Positron without the need for reticulate package?
Yes, you should be able to run R and Python in the same file but different cells using Jupyter notebooks in Positron without needing the reticulate package. Positron provides native, out-of-the-box support for both R and Python, allowing you to execute code from both languages seamlessly within the same environment. This includes support for Quarto documents, making it easier to integrate R and Python code in a single file.
@@milos-makes-maps this is excellent!
Positive comment for algorithm.
Much obliged! Let's go!
What do you think about Positron? 🤔
Fantastic doc Milos!!
Thank you so much! I'm glad you enjoyed my new vid!
Since i installed it almost a month ago, I haven't used R studio since then😢, positron is so much cleaner and somehow faster🤔 and the transition between R and Python is a breeze🍂
That sounds awesome and I'm happy this transition worked for you
Sir, how can i use my own shp file in this project??
Also how can I use my own LULC tif imagery??
You can use st_read from sf package to load your shapefile like this: country_sf <- sf::st_read("my_shapefile.shp")
@@milos-makes-maps thanks a lot sir, and how to use any other LULC tif image instead of ESRI live atlas
Can you add coordinates to your maps?
I have a problem and it says "ERROR: dependencies 'rgl', 'terrainmeshr', 'rayimage', 'rayvertex', 'rayrender' are not available for package 'rayshader' * removing 'C:/Users/AppData/Local/R/win-library/4.3/rayshader'" how can i fix it?
Thanks a lot. It was really helpful. Keep it up Milos.
love your videos! what should i do if i am having trouble installing rayshader and rayrender? i keep getting this error: Error: Could not find tools necessary to compile a package
Thank you so much! It looks like you don't have RTools installed. Please find the guidelines here: ruclips.net/video/HzGVz8ju3W8/видео.html
Can I have codes : TIA
I am stuck with the opening up the R terminal part on VS code. The error message I get is "Cannot find R for creating R terminal. Change setting r.rterm.windows to R path." Any suggestions?
Hi Milos, first of all, congratulations on your maps, they are really good, and thank you for sharing your knowledge in R and map composition. A question: What are the components you use in your computer to make the maps (RAM, processor, graphics card)? When the maps are plotted, do they take a long time to render? I ask because I have tried on my laptop and it usually gets stuck because the actions require a lot of power.
When creating the wkt under country rivers it doesn't show up in the library, what could be the reason? I cannot create wkt_filter = bbox_wkt
Excellent tutorial Milos, but at the end of the video the map that is on LinkedIn in yellow with those brown population peaks is not there... forgive me, as I haven't done the tutorial yet. Thank you in advance and congratulations once again.
Hi Ivan, thank you so much for your kind words! I’m glad you enjoyed the tutorial. Just to clarify, the tutorial is intended as a demo, and I often change color palettes for different projects. The map you mentioned with the yellow and brown population peaks on LinkedIn might not be included in this specific tutorial. Feel free to reach out if you have any questions while going through the tutorial. Thanks again for your support!
Thanks, Milos. This is very useful. However, it seems that after updates in Earth Data platform, MODIStsp authentication process (user and pass) does not work. I get the error: "Username and/or password are not valid. Please provide valid ones!", although I am sure the credentials are correct. Do you have any ideas how to solve this? Have you recently used this package to download data from MODIS? I can see from Earth Data dashboard that you can authorize applications and generate bearer tokens, but I don't know if I can set this in MODIStsp package configurations!
The population points are completely wrong - none of the other major conglomerations are in place (Graz, Linz, Salzburg, Wiener Speckgürtel, etc.).
Points are not supposed to be in the place of major cities because they are randomly placed to display population density.
This video is a must-watch for anyone starting with R, Rtools, and RStudio, especially before diving into any scripts. Many of us new to GIS and map-making with R often face challenges with version, path, installation, registry and environment issues. The simplest videos are often the most crucial. Thank you Milos for your awesome maps and data visualizations using R! I'm hoping to replicate some of your beautiful and stunning maps after a clean installation of R.
Thank you so much for your kind words, James! I'm thrilled to hear that you find my video helpful and inspiring for your work with GIS and map-making in R. It's always great to know that my content is assisting others in overcoming installation and setup challenges. If you ever have any questions or need further assistance while working on your maps, feel free to reach out.
🎉🎉🎉🎉🎉
Great
Perfect.
Thanks a lot Milos for your amazing tutorial. It was amazing and I learned a lot! ilove your coding style and also the new packages that you use.
Geological Map with R, please. Your a job is amazing
For version 4.4.1 or later version, you dont need to set this command, just use install.packages("languageserver")
Just got a problem but resolved by myself is, when in the RGui, run: "languageserversetup::languageserver_install()" will cause an error, if not install Rtools. So install Rtools first before the tutorial.
Thanks for the tip! Can you share the error message?
Your tutorials are very helpful and interesting. However, I think you're a bit too fast with the processing. I get lost at some points.
I'm glad to hear the tutorials are helpful! If you find the pace a bit quick, RUclips allows you to adjust the playback speed. You can slow it down to catch all the details, or even pause whenever you need more time.
@@milos-makes-maps you're absolutely right! I should be doing that. I want to learn R by watching your tutorial videos. Thanks so much for sharing your knowledge free of charge.
@@mamadeem.kamara4279 Thanks for following my tutorial and keep up the good work!
Sir you should make more tutorials on R use. you are doing great work. Amazing
Hi Milos, after much effort I was finally able to make the settings, now I have a question. I can easily get the country borders, but now I only want to get the provincial border of Istanbul, how can I do this?
Hey, you can use gadm function from geodata package as I show in, for example, this tutorial: ruclips.net/video/NY34O3H9qQQ/видео.htmlsi=geEUp-Lc6e3HcQcJ
@@milos-makes-maps What is the source of the error "wkt" "I installed the sp package and it shows up in it but not in the libraries when writing!
very useful
I have problem in installing rayshader version 0.35.7 , it gives me error message that "Error in download_version_url(package, version, repos, type) : version '0.35.7' is invalid for package 'rayshader'" Please help me with this.
Hello, I re-run the code on my machine and it installs rayshader version 0.35.7 Are you also running this code? remotes::install_version( "rayshader", version = "0.35.7", repos = "cran.us.r-project.org" )