Это видео недоступно.
Сожалеем об этом.
Charts in angular with JSON Server REST API | angular charts using chart.js | angular 14 full course

HTML-код
- Опубликовано: 3 окт 2022
- #angular14 #charts #chartjs
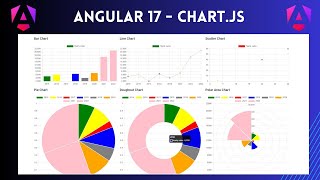
This video explains the implementation of below types charts using chat.js
1, Bar Chart
2, Pie Chart
3, doughnut Chart
4, radar Chart
5, polar Area Chart
6, Bubble Chart
7, Scatter Chart
Join this channel to get access to perks:
/ @nihiratechiees
Source Code GitHub Link
----------------------------------------
github.com/nihira2020/Datatra...


Hi, I'm from Argentina and I really appreciate the video and sharing your knowledge.
Great. Thanks for your wonderful words
baby and rooster sounds in the background have an effect. nice and nice explanation :) thanks
Future videos, try to have better background
To all programmers who believe they can teach others solely based on their technical knowledge, it's crucial to recognize that proper English and pronunciation are just as important, if not more so, than your technical expertise. Teaching effectively requires clear communication, and that includes being able to articulate concepts in a way that others can easily understand. So, while your knowledge is undoubtedly valuable, it must be conveyed with clarity through proficient language skills.
Thanks for your feedback. Will try my level best
This is amazing man, effortless and perfect. Good job
Thanks for the wonderful words👍
you're a superhero
Thanks
Please make video on full calendar which include add, edit events also in angular without using angular material
Will upload on upcoming weeks
please Sir, i have a problem with my chart.js, my graph are without color , it is gray, please help me
Have you added the styles?
Failed to create chart: can't acquire context from the given item. How ?
Please cross check with my source code. Link available in description
Other wise send me mail
Thank You so much sir
Welcome
Sir actually if i want to render chart based on user selection like when user select particular chart name from dropdown then only that chart i want to render then how i can implement this
Instead of load all chat same time.... Just have once element in html side.... Also have one dropdown..... Based the report selection pass repor type and data as parameter and Re render once again.
@@NihiraTechiees ok sir thanks
bro i have a quest after one year of uploadin this video😁😁 that which method do u use to show data of component in page of chart there I see that u not even open the chart page during routing how ? pls anyone who know 's pls reply ..
I am unable to remember so could you send mail with details
Very nice. Has anyone tried making a clickable bar chart (i.e. you click a bar it takes you to page A, click another it takes you to page B etc.) in Angular? I've tried based on their API section of the docs but get the "Cannot read properties of undefined (reading 'getElementsAtEventForMode')". Thanks.
Update: figured it out. I was using 'this' in an anonymous function instead of the fat arrow => , so 'this' was the wrong context. All good.
Great, for additional content
Hi Sir, I am trying to get the ngx line chart to get data from api. I am using Angular 13 and spring boot for backend. Is there any example i can follow.
Ngx i will create future
i love you bro thanks for anythings tkm
Thanks for the support, if possible try to join our membership
Thanks Mann!!
Welcome🎉
Thanks 🙏
Welcome
Hi where to use mychart constan its saying its unused
did you followed all steps. also cross check with my GitHub source
WOW!!! 👻
👍
Trying with your code, only getting 2 charts (bubble & scatter only) !!
Follow the steps in video
even tried with your code base also@@NihiraTechiees
Please make one video regarding Multi Step Form with Step Progress Bar in angular bro
Multi step form? Could you explain me more
@@NihiraTechiees bro its look like multi step form slider single page but fill the page first page in the form top page 1 is there then after filled the page below next button is there if u fill fille the page then move page 2 slider like that bro
page 1 page 2 page 3 page 4 ... availabel in the top every page after fill below next button is there after complete the final page then submit the whole form like that bro
Got it
how to remove a grid in the chart?
Are you still facing issue?
Sir how to update image using api in angular
ruclips.net/video/_uWkxyLeMmY/видео.html follow this video
Thank you sir ❤
Line chart???
Line char also included