Hi everyone 👋 It’s been a while since I post this video, and it’s time to reflect back. First, there are multiple ways to visualize attention in vision transformers. This paper (“Transformer Interpretability Beyond Attention Visualization”, arxiv.org/abs/2012.09838v1 ) compared different visualization methods. What I did in this video is just testing the attention at the first layer by feeding a test image and pulling out the response, which are the query, key, and value matrices. Multiplying the query matrix with the transposed key matrix gives us a squared matrix showing how each patch is “paying attention” to every other patch. If we order the patches back to their positions in the original image, we’ll see which patches have the highest attention values. I updated the code by adding more comments and printouts, just to make it more readable.
This is exactly what I've been trying to find for model visualization. Thank you! It's difficult finding any in-depth info on transformers involving the query, key, and value matrices.
very informative, Can you please make a video on vision mamba or Vmamba and explain the theoretical as well as the implementation part ? Looking forward
Thanks, I just checked VMamba on github. Sure I'll add it to my todo list. The thing is I'm recording a series on graph neural networks. Once I'm done with that, I'll get back to vision transformers.
I guess you want maps similar to the ones in this paper: Dzmitry Bahdanau, Kyunghyun Cho, and Yoshua Bengio. Neural machine translation by jointly learning to align and translate, 2014 If that's the case, I'm sorry I'm not familiar with that topic.


Hi everyone 👋
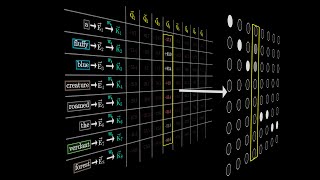
It’s been a while since I post this video, and it’s time to reflect back. First, there are multiple ways to visualize attention in vision transformers. This paper (“Transformer Interpretability Beyond Attention Visualization”, arxiv.org/abs/2012.09838v1 ) compared different visualization methods.
What I did in this video is just testing the attention at the first layer by feeding a test image and pulling out the response, which are the query, key, and value matrices. Multiplying the query matrix with the transposed key matrix gives us a squared matrix showing how each patch is “paying attention” to every other patch. If we order the patches back to their positions in the original image, we’ll see which patches have the highest attention values.
I updated the code by adding more comments and printouts, just to make it more readable.
This is exactly what I've been trying to find for model visualization. Thank you! It's difficult finding any in-depth info on transformers involving the query, key, and value matrices.
Thank you, that's great to hear.
I'm currently working on a Swin transformer visualization video. Hopefully, I'll post it in a week or so.
very informative, Can you please make a video on vision mamba or Vmamba and explain the theoretical as well as the implementation part ? Looking forward
Thanks, I just checked VMamba on github. Sure I'll add it to my todo list. The thing is I'm recording a series on graph neural networks. Once I'm done with that, I'll get back to vision transformers.
Could you the same but for NLP
I guess you want maps similar to the ones in this paper:
Dzmitry Bahdanau, Kyunghyun Cho, and Yoshua Bengio. Neural machine translation by jointly learning to align and translate, 2014
If that's the case, I'm sorry I'm not familiar with that topic.