OMG, this tutorial is perfection, I´m serious. You make it sound so easy and you explain every single step. Also, that is the prettiest plot I´ve seen. Thank you so much for this.
I had listened to several other lectures on this topic but the pace and the detail covered in this video is simply the best. Please keep up the good work!
I never comments on videos, but you really saved me here. Nothing was working on my dataset and this came smoothly. Well done on the explanations too, everything as crystal clear.
I have my exam in 2 days and Your video saved me tons of effort in combing through so many other articles and videos explaining PCA. A BIG Thank You! Hope you do many more videos and impart your knowledge to newbies like me. :)
really love your explanantion! thank you so much for your video, really helpful and i can understand it! keep it up! looking forward to your many more upcoming videos
I can say for sure that it´s the best explanation I´ve ever seen!! Go on and I would be really grateful if you make one of Time Series and Forecasting :)
Very nice tutorial, nicely explained and really complete, looking forward to learn more in R with other of your vids, thank you for the tremendous help!
Thank you so much for this SUPER helpful video. (P.S. The explanation with the iris dataset was especially convenient for me as I'm working on a dataset with dozens of recorded plant traits:D)
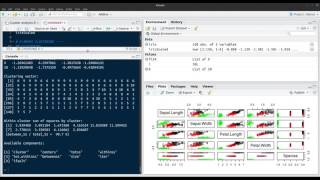
Can I confess something that baffles me? Because, I see this all the time. OK, so you, personally, are motivated to share your knowledge with the world, right? I mean, you took time, effort, energy, focus, planning, equipment, software, etc. to prepare this explanation and exercises. You screen-captured it, you set up your microphone, you edited the video, you did all this enormous amount of work. You're clearly motivated. Yet, when it actually comes time to deliver that instruction, you think it is 100% acceptable to place all your code into an absolutely miniscule fraction of the entire screen. Like, pretty-close to 96% of the screen is 'dead-space' from the perspective of the learner. The size of the typeface is miniscule (depending on your viewing system). It would be like producing a major blockbuster film, but then publishing it at the size of a postage stamp. Surely, it would be possible for you to 'zoom-into' that section of the IDE to show people what it was you were typing - the operators, the functions, the arugments, etc. I'm not really picking on you, individually, per se. I see this happen all the time with instructors of every stripe. I have this insane idea that instruction has much, much less to do with the insturctor's ability to demonstrate their knowledge to an uninformed person and has much, much more to do with the instructor's ability to 'meet' the student 'where' they are and to carry the student from a place of relative ignoracne (about a specific topic) to a place of relative competence. One of the best tools for assessing whether you're meeting that criteria is to PRETEND that you know nothing about the topic - then watch your own video (stripping-out all the assumptions you would automatically make about what is going on based on your existing knowledge). If you didn't have a 48" monitor and excellent eye-sight, would you be able to see what was being written? Like... why would you do that? If writing of the code IS NOT important - don't bother showing it. If writing of the code IS important, then make it (freaking) visible and legible. This really baffles me. I guess instructors are so "in-their-own-head" when they're delivering content, they don't take time to realize that no one can see what is happening. . It just baffles me how often I see this.
If 'zooming-in' is not easily achieved, the least instructors could do is go into the preferences of the IDE and jack-up the size of the text so that it would be reasonably legible on a screen typical of, say, a laptop or tablet. It just seems like such a low-hanging fruit, and easy fix to facilitate learning and ensure legibility.
Amazing video Hefin, there are lot of details covered in 27 min video, we just have to be careful not to miss any second of the video. I have a question: How does the scores are calculated for each PC's ? Why do we have to check the correlation between the variables and the PC1 & PC2 ? what value it adds practically ?
Thank you so much for your videos!! Your videos are the best I have seen hands down :) All of your explanations and step by step through R are what I needed to work on my research. One area I am having trouble with (since I am not a statistician) is making sure I run my data through all the necessary statistical tests before running the PCA. My data is similar to the iris dataset (skull measurements categorized by family and subfamily levels) but I am seeing different sources run different tests before the PCA (ANOVA vs non-parametric tests). If anything, would you be able to recommend some good sources for me to refer to? Thank you! I really appreciate it!
Ok so the Sepal.Width contributes mostly over 80% to the PC2 and the other three to PC1 more. 14:32 and so Sepal Width is fair enough as an info to separate setosa in the next plot. Isn't it also advisable to apply pca to linear problems?
You're correct about the relative contributions of the variables to each principal component. The Setosa species is discriminated from the other two species mainly by PC1, to which sepal.width contributes less that than the other variables. As PCA is a linear dimension reduction technique, it will best reveal clusters of cases that are linearly separable, but PCA is still a valid and useful approach to compress information, even in situations where this isn't true, or when we don't know about the structures in the data. Non-linear techniques such as t-SNE and UMAP are excellent at revealing non-linearly-separable clusters of cases in data, but interpreting their axes is very difficult/impossible.
Thank you Hefin Rhys for explaining PCA in detail. Can you please explain how to find weights of a variable by PCA for making a composite index? Is it rotation values that are for PC1, PC2, etc.? For example, if I have (I=w1*X+w2*Y+w3*Z) then how to find w1, w2, w3 by PCA.
At 5:50, don't you mean that if we measured sepal width in kilometers then it would appear LESS important? Because if we measured it in kilometers instead of millimeters, our numerical values will be smaller and vary far less, making it less important in the context of PCA. Thank you for this video.
Yes, you're absolutely correct! What I meant to say was that if that length was kilometers, but we neasured it in millimeters, then it would be given greater importance. But yes, larger values are given greater importance.
If I may suggest something, please make the script available for download. It would be very helpful for people beginning to learn R language. Once again, congrats for the video.
Amazing tutorial. Very simple and straight to the point. Already subscribed. I have some questions. PCA is an unsupervised method, isn't it? Is it possible to further decompose the data for Versicolor and Virginica to find further grouping? I have read before there are supervised methods. Do you have some tutorial for those?
Thanks enthiran! Yes, PCA is unsupervised because we don't give it any information about group membership, we give it unlabelled data and let if find the optimal projection of the data into a lower dimensional space that maximises the explained variance. If you wanted to build a model to predict group membership, then you would need to use a supervised cluster analysis algorithm, where you supply a training dataset with grouping labels (this is what makes it supervised). The algorithm will then learn which features in the data associate with each group, such that when you give the model unlabelled data, it will predict group membership. I have a video on various clustering algorithms here: ruclips.net/video/PX5nSBGB5Tw/видео.html
Hi Hefin, Thanks for this tutorial. What do we do if PC1 and PC2 can only explain around 50% of the variation? Do we also include PC3 and PC4? If so, how?
Many thanks for your efforts to make this complex issue much easier for us. Could you enlight me to understand group similarly and dissimilarity using pca?
Very cool Hefin. I'm trying to run a data reduction for panel data (220 countries, about 25 years of data, and about 100 different variables). Could PCA be used for this?
Hi Simon, it will depend on what kind of data you have and what your goal is. All the variables will need to be numeric as PCA can't handle categorical variables (check out independent correspondence analysis for this). If you want to find linear combinations of variables to explain most the variation in the data, then PCA is a good choice. If you're just interested in seeing whether there are subgroups of subjects in your dataset, you might want to try a non-linear dimension reduction algorithm like t-SNE or UMAP :)
This is a very comprehensive video, great job!! I have one query, you have shown to create a bilpot with PC1 and PC2. How can I make a biplot using PC1 and PC3? I will really appreciate if you reply back.
It was fine for me once I switched to full screen and changed the quality to 1080p HD. Also, you can download his R code (link in description) and run it in your own R program along with him, so you can see it better there.
Hi! I have a question, does it make sense to run a PCA on discrete data? I am trying something using your tutorial as a guide but I get a weird result in the plot, and I am wondering it it is because of the nature of my data. Thanks
Great question! If your data are not ordinal, you may get some use out of PCA if you numerically encode your discrete variables, but you may get more out of Multiple Correspondence Analysis (MCA) than PCA. Have a look here: www.rpubs.com/piterii/dimension_reduction
Hey Hefin, Amazing video! I am working on my own PCA at the moment. If at all possible would you be able to go over a few questions with me? I would appreciate any advice you would be able to give.


OMG, this tutorial is perfection, I´m serious. You make it sound so easy and you explain every single step. Also, that is the prettiest plot I´ve seen. Thank you so much for this.
You're very welcome! If you like pretty plots, check out my video on using ggplot2 ;) ruclips.net/video/1GmQ5BdAhG4/видео.html
I had listened to several other lectures on this topic but the pace and the detail covered in this video is simply the best.
Please keep up the good work!
Thanks Sadia! Glad to be of help.
Never a tutorial about PCA so clear and simply. Thanks
I'm in graduate school and you just explained PCA better than my professor. GOD BLESS YOU!!!!
Noone explains R better than Hefin. Give this man a medal already!!
5 year old video still one of the best I found on the topic on YT. Thumbs up
Finally a perfect tutorial for POA in Rstudio. Thanks mate!
How i came across this video a week before ,my final year, project due date is a miracle. Thank you so much Hefin Rhys.
Jackie Mwaniki doing?
@@mohamedadow8153 my topic is on Macroeconomic factors and the stock prices using the APT framework.
I never comments on videos, but you really saved me here. Nothing was working on my dataset and this came smoothly. Well done on the explanations too, everything as crystal clear.
really useful video thank you, I've just started my MSc project using PCA, so thank you for this. I will be following subsequent videos.
I have my exam in 2 days and Your video saved me tons of effort in combing through so many other articles and videos explaining PCA. A BIG Thank You! Hope you do many more videos and impart your knowledge to newbies like me. :)
Quite literally, the best tutorial I've ever seen on an advanced multivariate topic. Job well done, sir!
Damn, your accent is hypnotic! The explanation is good too!
Thanks! 😘
In fact I found out how to overcome the multicolinearity , by using the eigen values of PC1 and PC2! I love PCA!
Explained everything one might need. If only every tutorial on RUclips is like this one!
The best run through I've seen for using and understanding PCA.
Excellent tutorial. I have used this for analysis of my research. Thanks a lot for sharing your valuable knowledge.
Excellent! Words cannot show how grateful I am!
In all honesty this is the best tutorial I've seen in months. Nice job!
I've been going through your tutorials and I'm so impressed. Legend!!!
Best explanation I’ve found so far! Thanks mate, legend!
Uploaded the script as well what a guy
This video gave a major leap in my study. Thanks.
its so funny I don't think you realize but myPR "my pyaar" in Urdu/Hindi means my love. Thank you for an amazing and extremely helpful video
Great help, been doing my own work following step by step this tutorial...the whole night
Excellent walkthrough. Thank you!
The explanation is just perfect. Thank you.
Great video. Very instructive. Please keep making them
This tutorial is outstanding. Excellent explanation! Thank you very much!!!
Added to my stats/math playlist! Very useful.
really love your explanantion! thank you so much for your video, really helpful and i can understand it! keep it up! looking forward to your many more upcoming videos
Thanks for the the video, it helped me a lot!! Your explanation is very didactic!
This is gold. I absolutely love you for this
I can say for sure that it´s the best explanation I´ve ever seen!! Go on and I would be really grateful if you make one of Time Series and Forecasting :)
Thanks Elena! Thank you also for the feedback; I may make a video on time series in the future.
Very nice tutorial, nicely explained and really complete, looking forward to learn more in R with other of your vids, thank you for the tremendous help!
Thank you! I'm glad it helped.
Excellent tutorial Hefin. Hooked and subscribed...
Vesselin Nikov thank you! Feel free to let me know if there are other topics you'd like to see covered.
this tutorial is slap bang fuckin perfect, god bless you, you magnificant bastard
😘
@@hefinrhys8572 stats assignment due in 12 hours and you saved me alot of hassle
Thank you so much for the very clear and concise explanation!
Thank you so so much!! You just saved the day and helped me really understand my homework for predictive analysis.
It is a really nice and clear tutorial! Thanks a lot, Hefin~
You're welcome Flora! Thank you!
Thank you so much! This is GREAT! You explained very clearly and smoothly.
Perfect! Never seen such explanation
thank you so much for this video. incredibly helpful.
Finally understood this goddamn topic! Thank you dude
Thank you so much for this SUPER helpful video. (P.S. The explanation with the iris dataset was especially convenient for me as I'm working on a dataset with dozens of recorded plant traits:D)
Great teacher you are, thanks
You are really a life saver! Thank you!
Thanks for nice and easy way of explanation.It really helps me a lot.
Can I confess something that baffles me? Because, I see this all the time. OK, so you, personally, are motivated to share your knowledge with the world, right? I mean, you took time, effort, energy, focus, planning, equipment, software, etc. to prepare this explanation and exercises. You screen-captured it, you set up your microphone, you edited the video, you did all this enormous amount of work. You're clearly motivated. Yet, when it actually comes time to deliver that instruction, you think it is 100% acceptable to place all your code into an absolutely miniscule fraction of the entire screen. Like, pretty-close to 96% of the screen is 'dead-space' from the perspective of the learner. The size of the typeface is miniscule (depending on your viewing system). It would be like producing a major blockbuster film, but then publishing it at the size of a postage stamp. Surely, it would be possible for you to 'zoom-into' that section of the IDE to show people what it was you were typing - the operators, the functions, the arugments, etc. I'm not really picking on you, individually, per se. I see this happen all the time with instructors of every stripe. I have this insane idea that instruction has much, much less to do with the insturctor's ability to demonstrate their knowledge to an uninformed person and has much, much more to do with the instructor's ability to 'meet' the student 'where' they are and to carry the student from a place of relative ignoracne (about a specific topic) to a place of relative competence. One of the best tools for assessing whether you're meeting that criteria is to PRETEND that you know nothing about the topic - then watch your own video (stripping-out all the assumptions you would automatically make about what is going on based on your existing knowledge). If you didn't have a 48" monitor and excellent eye-sight, would you be able to see what was being written? Like... why would you do that? If writing of the code IS NOT important - don't bother showing it. If writing of the code IS important, then make it (freaking) visible and legible. This really baffles me. I guess instructors are so "in-their-own-head" when they're delivering content, they don't take time to realize that no one can see what is happening. . It just baffles me how often I see this.
If 'zooming-in' is not easily achieved, the least instructors could do is go into the preferences of the IDE and jack-up the size of the text so that it would be reasonably legible on a screen typical of, say, a laptop or tablet. It just seems like such a low-hanging fruit, and easy fix to facilitate learning and ensure legibility.
@@EV4UTube chill out dude
Sweet baby Jesus. Thank you for making this video!
You're very welcome!
a perfect tutorial for PCA... Thank you
simple and clear. very good
You "R" AWESOME!!!
Super well-explained, thank you!
Amazing video Hefin, there are lot of details covered in 27 min video, we just have to be careful not to miss any second of the video. I have a question: How does the scores are calculated for each PC's ? Why do we have to check the correlation between the variables and the PC1 & PC2 ? what value it adds practically ?
Outstanding. Thank you.
thank you so much! you are the best, very clear explanation.
Fantastic video Hefin! thanks
Very nice, guys hit the subscribe button, the best explanation so far.
Clear and straight forward, good work!
Bully for you! Lol
Very informative and clear Thanks.
amazing video, thank you
Very helpful, thanks!
Good tutorial!I have learnt a lot. Thanks !
just brilliant
Thank you so much for this tutorial, it really helped me!
Thanks much Hefin!!!
Thank you so much for your videos!! Your videos are the best I have seen hands down :) All of your explanations and step by step through R are what I needed to work on my research.
One area I am having trouble with (since I am not a statistician) is making sure I run my data through all the necessary statistical tests before running the PCA. My data is similar to the iris dataset (skull measurements categorized by family and subfamily levels) but I am seeing different sources run different tests before the PCA (ANOVA vs non-parametric tests). If anything, would you be able to recommend some good sources for me to refer to? Thank you! I really appreciate it!
this video is fab thank you!
Thank you Emily! Happy dimension reduction!
Ok so the Sepal.Width contributes mostly over 80% to the PC2 and the other three to PC1 more. 14:32 and so Sepal Width is fair enough as an info to separate setosa in the next plot. Isn't it also advisable to apply pca to linear problems?
You're correct about the relative contributions of the variables to each principal component. The Setosa species is discriminated from the other two species mainly by PC1, to which sepal.width contributes less that than the other variables. As PCA is a linear dimension reduction technique, it will best reveal clusters of cases that are linearly separable, but PCA is still a valid and useful approach to compress information, even in situations where this isn't true, or when we don't know about the structures in the data. Non-linear techniques such as t-SNE and UMAP are excellent at revealing non-linearly-separable clusters of cases in data, but interpreting their axes is very difficult/impossible.
Thank you! This was very helpful to me
Amazing video! Thanks for the explaining everything very simply. Could you please do a video on PLS-DA?
Fantastic!
Thanks Hefin :)
Thank you Hefin Rhys for explaining PCA in detail. Can you please explain how to find weights of a variable by PCA for making a composite index? Is it rotation values that are for PC1, PC2, etc.? For example, if I have (I=w1*X+w2*Y+w3*Z) then how to find w1, w2, w3 by PCA.
Thank you, it was very helpful.
Top notch. Thank-you.
Thank you. Very helpful.
Thanks for the video..helped a lot :)
ABHI agni Glad it helped :) Feel free to give feedback on other topics that would be useful.
At 5:50, don't you mean that if we measured sepal width in kilometers then it would appear LESS important? Because if we measured it in kilometers instead of millimeters, our numerical values will be smaller and vary far less, making it less important in the context of PCA.
Thank you for this video.
Yes, you're absolutely correct! What I meant to say was that if that length was kilometers, but we neasured it in millimeters, then it would be given greater importance. But yes, larger values are given greater importance.
@@hefinrhys8572 Alright, thanks for the reply and for the video!
Damn good job!
Thanks Daniel!
If I may suggest something, please make the script available for download. It would be very helpful for people beginning to learn R language.
Once again, congrats for the video.
Hi Bruno, this is a great suggestion thank you. I agree it would be worthwhile; I just need to find the time to upload the scripts haha.
The script is now available to download from the video description. Sorry it took me so long!
Hello! Thanks for the video, just a question how would you modify the code if you have NA values? In advance, thank you!
Thanks for the tutorial!!
Amazing tutorial. Very simple and straight to the point. Already subscribed. I have some questions. PCA is an unsupervised method, isn't it? Is it possible to further decompose the data for Versicolor and Virginica to find further grouping? I have read before there are supervised methods. Do you have some tutorial for those?
Thanks enthiran! Yes, PCA is unsupervised because we don't give it any information about group membership, we give it unlabelled data and let if find the optimal projection of the data into a lower dimensional space that maximises the explained variance. If you wanted to build a model to predict group membership, then you would need to use a supervised cluster analysis algorithm, where you supply a training dataset with grouping labels (this is what makes it supervised). The algorithm will then learn which features in the data associate with each group, such that when you give the model unlabelled data, it will predict group membership. I have a video on various clustering algorithms here: ruclips.net/video/PX5nSBGB5Tw/видео.html
Hi Hefin,
Thanks for this tutorial. What do we do if PC1 and PC2 can only explain around 50% of the variation? Do we also include PC3 and PC4? If so, how?
Many thanks for your efforts to make this complex issue much easier for us. Could you enlight me to understand group similarly and dissimilarity using pca?
THANK YOU SO MUCH
Thank you!
Thanks for the link to the R code.
thank you very much
awesome tutorial
Thank you!
Great presentation! However, why did you not binarize the categorical variable first, and then do the subsequent analysis?
Thanks!
Nice !!!!!!!!!!!
Thanks ajak!
Thanks
Very cool Hefin. I'm trying to run a data reduction for panel data (220 countries, about 25 years of data, and about 100 different variables). Could PCA be used for this?
Hi Simon, it will depend on what kind of data you have and what your goal is. All the variables will need to be numeric as PCA can't handle categorical variables (check out independent correspondence analysis for this). If you want to find linear combinations of variables to explain most the variation in the data, then PCA is a good choice. If you're just interested in seeing whether there are subgroups of subjects in your dataset, you might want to try a non-linear dimension reduction algorithm like t-SNE or UMAP :)
This is a very comprehensive video, great job!!
I have one query, you have shown to create a bilpot with PC1 and PC2. How can I make a biplot using PC1 and PC3?
I will really appreciate if you reply back.
Try: biplot(myPr, choices = c(1, 3)) 😀
Good video but due to background color and small font size not very clear, thanks for considering it in next videos, thanks
It was fine for me once I switched to full screen and changed the quality to 1080p HD.
Also, you can download his R code (link in description) and run it in your own R program along with him, so you can see it better there.
Hi! I have a question, does it make sense to run a PCA on discrete data? I am trying something using your tutorial as a guide but I get a weird result in the plot, and I am wondering it it is because of the nature of my data. Thanks
Great question! If your data are not ordinal, you may get some use out of PCA if you numerically encode your discrete variables, but you may get more out of Multiple Correspondence Analysis (MCA) than PCA. Have a look here: www.rpubs.com/piterii/dimension_reduction
Thank again. Quick one....Would you mind also doing the Fama and Macbeth Analysis without using the KenFrench Dataframe?
Hey Hefin,
Amazing video! I am working on my own PCA at the moment.
If at all possible would you be able to go over a few questions with me?
I would appreciate any advice you would be able to give.