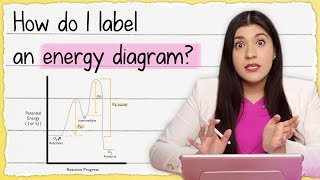
Reaction Rate and the Reaction Coordinate Diagram
US
Войти
Rate Constant and Factors Affecting Reaction Rate
4:36
Le Chatelier's Principle
15:04
Exothermic Energy Diagram: Activation Energy, Transition States and Enthalpy Change - TUTOR HOTLINE
8:40
SIDEMEN AMONG US MAGE ROLE: CAST A LIGHTNING STRIKE TO WIN
45:06
OUR FIRST 24 HOURS HOME WITH A NEWBORN + HER NAME REVEAL!!
20:02
Hollywood - Peso Pluma, Estevan Plazola (Video Oficial)
04:49
Reaction Rate and the Reaction Coordinate Diagram
MedSchoolCoach MCAT Prep
Подписаться
14 тыс.
Скачать
Готовим ссылку...
Просмотров 5 тыс.
0
0
Добавить в
Мой плейлист
Посмотреть позже
Поделиться
Поделиться
HTML-код
Размер видео:
1280 X 720
853 X 480
640 X 360
Показать панель управления
Автовоспроизведение
Автоповтор
Опубликовано: 25 дек 2024
Комментарии •
Следующие
Автовоспроизведение
4:36
Rate Constant and Factors Affecting Reaction Rate
MedSchoolCoach MCAT Prep
Просмотров 4,1 тыс.
15:04
Le Chatelier's Principle
MedSchoolCoach MCAT Prep
Просмотров 4,9 тыс.
8:40
Exothermic Energy Diagram: Activation Energy, Transition States and Enthalpy Change - TUTOR HOTLINE
Melissa Maribel
Просмотров 92 тыс.
45:06
SIDEMEN AMONG US MAGE ROLE: CAST A LIGHTNING STRIKE TO WIN
MoreSidemen
Просмотров 3,9 млн
20:02
OUR FIRST 24 HOURS HOME WITH A NEWBORN + HER NAME REVEAL!!
KB AND KARLA
Просмотров 323 тыс.
04:49
Hollywood - Peso Pluma, Estevan Plazola (Video Oficial)
Peso Pluma
Просмотров 4,1 млн
26:20
I Spent 100 Hours for IMPOSSIBLE Dragon Race V4 in Blox Fruits!
Kitt Gaming
Просмотров 722 тыс.
11:55
Definition and Equilibrium Constant
MedSchoolCoach MCAT Prep
Просмотров 5 тыс.
18:48
Writing Rate Laws of Reaction Mechanisms Using The Rate Determining Step - Chemical Kinetics
The Organic Chemistry Tutor
Просмотров 708 тыс.
12:02
Types of Solutes and Dissolution vs. Dissociation
MedSchoolCoach MCAT Prep
Просмотров 7 тыс.
11:32
Potential Energy Diagrams - Chemistry - Catalyst, Endothermic & Exothermic Reactions
The Organic Chemistry Tutor
Просмотров 499 тыс.
14:22
Standard Reduction/Oxidation Potential and Cell Potential
MedSchoolCoach MCAT Prep
Просмотров 10 тыс.
9:59
Reaction Quotient
MedSchoolCoach MCAT Prep
Просмотров 4 тыс.
26:12
How to Remember Everything You Read
Justin Sung
Просмотров 1,8 млн
12:10
Henderson Hasselbalch Equation
MedSchoolCoach MCAT Prep
Просмотров 6 тыс.
10:58
Acids and Bases - Buffers
MedSchoolCoach MCAT Prep
Просмотров 8 тыс.
01:00
ФИШКИ В КОРЕЙСКИХ РЕСТОРАНАХ🔥
Niky Sarang
Просмотров 211 тыс.
51:17
Купил ЗАБРОШЕННЫЙ ПОЕЗД! А там внутри ....
Дима Масленников
Просмотров 2,1 млн
27:25
У меня УКРАЛИ и РАЗБИЛИ ЛЮБИМУЮ МАШИНУ..
TheWarpath
Просмотров 116 тыс.
00:21
Confused🫣 Subscribe to me🙌
ILYA BORZOV
Просмотров 3,7 млн
00:34
Экипаж самолёта не выжил - МЧС Азербайджана
Khabar NEWS
Просмотров 112 тыс.
36:02
Самый СТИЛЬНЫЙ шуруповёрт ДЛЯ ДОМА
Мастерская Pit_Stop
Просмотров 223 тыс.
1:08:32
НОВОГОДНЯЯ 1000км НА ВЕДРЕ! ЗА ЁЛКОЙ НА СЕВЕР с Юрой Волковым
НИКИТОС
Просмотров 205 тыс.
00:56
Turning Melted Chocolate into Edible Art! 🍫🎨✨ #CreativeCooking #FoodArt
TrekNinja
Просмотров 6 млн