Using Microsoft Excel for Residual Analysis, Residual Plot and Histogram - Analytics

HTML-код
- Опубликовано: 22 авг 2024
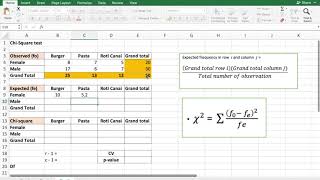
- This video focuses on residual analysis to check for outliers. The video also Explains on how to check the linearity and normality assumption using Microsoft Excel. Which is done via Scatter Plot, Residual Plot and Histogram.


thank you