Quantifying Forest Change using Google Earth Engine

HTML-код
- Опубликовано: 12 сен 2024
- 7 Days online training on Google Earth Engine for Remote sensing Analysis Beginner’s to Advanced:
Course Content:
1) Google Earth Engine: Introduction
2) Google Earth Engine 2: Filtering and Displaying Data
3) Google Earth Engine 3: Importing Raster and Vector Data
4) Google Earth Engine 4: Calculating with Images
5) Calculating NDVI, NDWI, and all indices.
6) Google Earth Engine 5: Introduction to Image Classification
7) Google Earth Engine 6: Landcover classification Map
8) Google Earth Engine 6: Exporting Raster and Vector Data
9) How to make a time-series chart for NDVI, NDWI, and other Indices
10) Spectral indices and develop the skills for calculating any index (NDVI, NDWI, NDSI, MNDWI, MSAVI)
11) How to remove CLOUD Mask from satellite Images
12) Visualization (DEM) of Hill shade and Slope Map in GEE using NASA SRTM
13) Google Earth Engine: How to make an NDVI chart over a period of time
14) Air Quality Monitoring: Nitrogen Dioxide (mol/m^2) density using Google Earth Engine JavaScript API
15) Air Quality Monitoring: Sulphur Dioxide (mol/m^2) density using Google Earth Engine JavaScript API
16) How to Download Air Quality parameters Timeseries data in CSV format using Google Earth Engine
17) How to make Landcover Classifications Charts in Google Earth Engine | LULC Map Chart
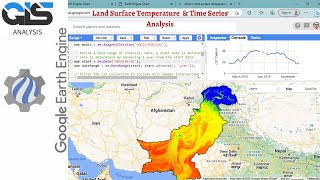
18) Land Surface temperature in GEE || Observe temporal patterns in LST using time series Chart in GEE
19) How to Calculate Average, Maximum & Minimum NDVI in Google Earth Engine
20) Google Earth Engine: How to ADD A LEGEND, Title in your Map
21) Calculating LULC Map Area in Google Earth Engine
For registration and enroll this course, contact this email: rmijanur10266@gmail.com or WhatsApp number: +8801780942798


Can you please provide code link of this