Thank you. The data science and R communities have been very good to me, so this is my way of giving back. As I have time I am taking the processes I use in data science at a 100 billion dollar a year company and creating tutorial videos so everyone else can see how we use data science in the business world to gain a competitive edge and gain incredible insights. Too many people leave graduate schools without real, practical applications. This is to help bridge this gap and make data science not only more achievable, but also more easily understood. Thanks again and be sure and look at all the other videos on my channel that cover everything from regression to forecasting to segmentation and predictions, etc.
Tech Know How As a graduate student in a public health program that’s tailored toward epidemiology and biostatistics, I can say that you are doing the lord’s work with these videos. I’m a fan for life
Wow, thanks! Glad you liked it. Please feel free to share this video and the other ones on my channel on social media so that others can benefit. I build the code and videos to make data science and analytics accessible to all regardless of resources, location, schooling, etc. Data science and analytics can be fun and rewarding and is something everyone can participate in and learn from. What would you like to see in a future video? Any ideas or recommendations? Thanks again and have a great day!
@@techknowhow4802 Hi Tech, I just gave a look at your channel and I should say you pretty much covered the important stuff about analysis in R, so really thank you for your efforts! It helps beginner like me to start data analysis in R very much. I'm actually don't have much of reccomendations to give you since, as I said, I'm just a beginner :) Perhaps you could kinda help me. How would you start to forecast revenues (for example) for the next 6 months where you have to consider 2 months, of the 6 you have to forecast, where the revenues are 0 or drastically low due to lockdowns (as unfortunately happened this year) or momentary cease of business? Btw thanks again for all the vids!
Awesome video! very informative and comprehensive. for those who is starting 'Arima' forecasting that would be very helpful. Thank you for doing that, bro!
That was the purpose of this video - to get beginners up quickly, forecasting in R. Who wants to sit for weeks in a class and see little results? Here is the data, code and entire process and how to do everything you need with an auto arima model in literally minutes! It is easy to follow and quick, so anyone can start doing arima forecasting on pretty much any time series based data. I am glad you liked it. Question - what would you like to see in future, upcoming videos?
thank you for this I have a few questions: 1- if i need to do forecast on alternate days, would I do the frequency 365/2? 2- if I have info for 5 working days, the frequency would be? 3- do I have to have evenly spaced info? what about vaccations? 4- if data isn't spaced evenly what to do?
Glad you liked it. Question for you - What would you like to see in an upcoming video? Sentimental analysis, more r code and examples, or something else?
Great Video! very brief and easy to follow, Question i have, can we use "Arima" to forcast a combination of fields of data, 3 to 5 fields at the same time?
Why would you want to do that? Your accuracy would be very bad. Instead loop through the process and pull multiple models. Higher accuracy = better forecasting every time. :)
David, I followed your process and my time series worked until I wanted to plot the forecast model when this warning came up- Error in xy.coords(x, y, xlabel, ylabel, log) : 'x' is a list, but does not have components 'x' and 'y'. I need some help with that please, anybody?
Check out this page from the community at Stackoverflow.com. It deals specifically with your error. stackoverflow.com/questions/12004068/x-is-a-list-but-does-not-have-components-x-and-y
so when I forecast using the auto arima and use autoplot to plot it, something weird happens. On the x axis it shows the time like it should, but on the Y axis instead of showing me the values of data it shows the frequencies instead. How can i change this??
Good evening. I would just like to ask something. I have been searching across the internet regarding forecasting, and I noticed some people partitioning their data into training and test datasets. I just want to know, when exactly do you need to partition? In your video, you used the summary and accuracy functions on a single dataset instead of partitioning them and doing the steps on each partition. Please clarify, and please let me know if some of my words are not clear. Thank you.
It all depends on what you are trying to do. This is meant to be a simple and quick analysis. Look at some of my other videos on forecasting. Some (like the multi-part series ones) will have training and test datasets. Some take seasonality into account, use weekly and monthly moving averages and more. It all depends upon the data and what you wish to accomplish with it. Here is a great one on dealing with seasonality: ruclips.net/video/wi8vdeiPwuc/видео.html And here's another great one: ruclips.net/video/UekOBfpu8m8/видео.html Hope you find these video series on forecasting helpful. Thank you.
@@techknowhow4802 I have a set of yearly data, and I wish to forecast for the next years. I tried fitting models for the entire data and then forecasting for the next values, but then I came across the use of training and test data, so I tried checking my models' performance on training and test data ad well. I only want for make forecasts for the next few years. Is modelling on the whole data set enough, or is partitioning into training and test data still needed?
@@techknowhow4802 For additional context, I only have data from 2000 to 2018, and I want to forecast for the next few years. Also, my data are not partitioned into months or weeks or days; my data only had years.
Hi, thanks a lot for posting the video. I am trying to follow it and forecast on my own data. However, it keeps showing me "object of type 'closure' is not subsettable". I typed in start = c(2017,3) in the code as my data starts in 3/2017. The dates are saved as "dates" in the excel file. Is this what is causing it? How can I fix this?
That almost always means you are using a wrong bracket type somewhere in your code. R thinks you are referring to a function or similar. Check out this page on what causes this error and how to fix it. Thank you. coolbutuseless.github.io/2019/02/12/object-of-type-closure-is-not-subsettable/
MAPE = 2.47. Does it mean the model was totally inaccurate? ME RMSE MAE MPE MAPE MASE ACF1 Training set -0.01641758 3.346183 2.576781 -0.1203522 2.477265 0.5903279 0.09990205
Hello Sir! I am new in forecasting and R. I have these following questions: 1. If I build a model using auto.arima(data), I don't have to split my data (train and test) right? I just need to have the accuracy? the data is the test and train data sets itself right? 2. I have a data of sales of 200 product models for 1 month and 12 days in alternate days therefore, I have only 21 data points (sales) for 200 product models. How can I forecast them all in one go? Thank you very much sir!
Auto arima is more of a super quick way to determine a forecast. It isn't always the best or most accurate method. This is why there are many algorithms and models out there. If you look at my other videos on arimas and forecasting, in particular, you will see me place several models up against each other for comparison. I also use other algorithms. You need to look at your data and be able to determine which algorithm would work best and provide you and your audience with results you can be happy with.
Watch any of the auto arima or stock price forecasting videos on my channel. They all use auto arimas along with custom arima models with full code. Very easy to use and implement on any time series based dataset.
@@phamvuquynhnhu2089 look up if/then, do/while, case if and for looping structures. You would most likely need that to add the code for whatever other models you are building.
@@phamvuquynhnhu2089 that would all depend upon your data. Every dataset is different. Is there seasonality you need to deal with or remove? Look at the longer forecasting video series on my channel. They deal with comparing multiple models, testing your data, and even identifying and removing seasonality.:)
The link for the libraries in R? Google install.packages() or just look at the early parts to any of my videos that show R programming. They will show you how to install the packages or libraries.
The auto arima by itself does not take seasonality (other campaigns, internal and external influences, trending and more) into account. There are numerous other similar videos that take seasonality into account on my video channel. Just search my videos for seasonality and arimas. Thank you. :)
auto.arima() is not always the best model, thats why you need to look at ME, RMSE, MAE, MPE, MAPE, MASE, ACF1 and also AIC and BIC, and find the best combination, which will signal the best fit. The MAPE not exactly the measure what you need to look at, it will be very wrong model if you orienting to MAPE only. You may bee to experimenting with manual Arima() and choose the order (p,d,q). Note "A" is a typo here.
I was taught on campus using a diagnostic test model (p, d, q) checked one by one based on the truncated lag on acf and pacf, but it is a bit complicated if the truncated lot for a few lags


This is easily one of the best forecasting walkthroughs on YT. Many thanks!
Thank you. The data science and R communities have been very good to me, so this is my way of giving back. As I have time I am taking the processes I use in data science at a 100 billion dollar a year company and creating tutorial videos so everyone else can see how we use data science in the business world to gain a competitive edge and gain incredible insights. Too many people leave graduate schools without real, practical applications. This is to help bridge this gap and make data science not only more achievable, but also more easily understood. Thanks again and be sure and look at all the other videos on my channel that cover everything from regression to forecasting to segmentation and predictions, etc.
Tech Know How As a graduate student in a public health program that’s tailored toward epidemiology and biostatistics, I can say that you are doing the lord’s work with these videos. I’m a fan for life
Just saved my master thesis in economics...
Awesome. How did this help you? Was it for a forecasting problem or task? What were you trying to project?
What project were you working on? Care to share?
Plus 1 from Finance...
Awesome explanation, by now one of the best video on a quick time series forecasting!
Wow, thanks! Glad you liked it. Please feel free to share this video and the other ones on my channel on social media so that others can benefit. I build the code and videos to make data science and analytics accessible to all regardless of resources, location, schooling, etc. Data science and analytics can be fun and rewarding and is something everyone can participate in and learn from. What would you like to see in a future video? Any ideas or recommendations? Thanks again and have a great day!
@@techknowhow4802 Hi Tech, I just gave a look at your channel and I should say you pretty much covered the important stuff about analysis in R, so really thank you for your efforts! It helps beginner like me to start data analysis in R very much. I'm actually don't have much of reccomendations to give you since, as I said, I'm just a beginner :)
Perhaps you could kinda help me. How would you start to forecast revenues (for example) for the next 6 months where you have to consider 2 months, of the 6 you have to forecast, where the revenues are 0 or drastically low due to lockdowns (as unfortunately happened this year) or momentary cease of business?
Btw thanks again for all the vids!
Awesome video! very informative and comprehensive. for those who is starting 'Arima' forecasting that would be very helpful. Thank you for doing that, bro!
That was the purpose of this video - to get beginners up quickly, forecasting in R. Who wants to sit for weeks in a class and see little results? Here is the data, code and entire process and how to do everything you need with an auto arima model in literally minutes! It is easy to follow and quick, so anyone can start doing arima forecasting on pretty much any time series based data. I am glad you liked it. Question - what would you like to see in future, upcoming videos?
Thank you! So much faster than trial an error method in eviews my prof wants us to use for an assignment
Glad you found it helpful. ☺
can you please make a video on Hierarchical time series, Top-down and Bottom-up Time series.
Can you please make a video on block bootstrapping for time series? that will be very helpful to me. Thanks
thank you for this I have a few questions:
1- if i need to do forecast on alternate days, would I do the frequency 365/2?
2- if I have info for 5 working days, the frequency would be?
3- do I have to have evenly spaced info? what about vaccations?
4- if data isn't spaced evenly what to do?
Q1 :- use Google
Q4 :- before forecasting, First convert non stationary given data into stationary format.
Then check stationality and equally spaced.
one of the best out there .. thx
Glad you liked it. Question for you - What would you like to see in an upcoming video? Sentimental analysis, more r code and examples, or something else?
@@techknowhow4802.. more code and examples for sure .. maybe Neural Network Analysis and R code.. thx for asking
very helpful kindly make videos on forecasting through GARCH modelling
GREAT!!!! Thank..so clear and usefull :)
Great video! Can I use auto arima forecast without x code installing on Mac Sierra
Cannot thank you enough... from India
you said that auto arima function tend to give constant forecast values, what should i do to tackle this problem ? help me
Great Video! very brief and easy to follow, Question i have, can we use "Arima" to forcast a combination of fields of data, 3 to 5 fields at the same time?
Why would you want to do that? Your accuracy would be very bad. Instead loop through the process and pull multiple models. Higher accuracy = better forecasting every time. :)
If the data has seasonality Can I use this method?
Please tell me what will be the frequency For annual data ?
When I use auto.arima , should I also do first differencing or second differencing if my time series is non stationary ?
I have 1D data and want to do 1 step ahead forecasting how can i do that by using for loop
David, I followed your process and my time series worked until I wanted to plot the forecast model when this warning came up- Error in xy.coords(x, y, xlabel, ylabel, log) :
'x' is a list, but does not have components 'x' and 'y'. I need some help with that please, anybody?
Check out this page from the community at Stackoverflow.com. It deals specifically with your error.
stackoverflow.com/questions/12004068/x-is-a-list-but-does-not-have-components-x-and-y
thank you! is a good videos :)
Glad you like them!
so when I forecast using the auto arima and use autoplot to plot it, something weird happens. On the x axis it shows the time like it should, but on the Y axis instead of showing me the values of data it shows the frequencies instead. How can i change this??
my Mape values comes Inf , so what does it mean
May I know how to change the corresponding date on the x-axis?
Yes, please suggest how to get it in days.
Good evening. I would just like to ask something. I have been searching across the internet regarding forecasting, and I noticed some people partitioning their data into training and test datasets. I just want to know, when exactly do you need to partition? In your video, you used the summary and accuracy functions on a single dataset instead of partitioning them and doing the steps on each partition. Please clarify, and please let me know if some of my words are not clear. Thank you.
It all depends on what you are trying to do. This is meant to be a simple and quick analysis. Look at some of my other videos on forecasting. Some (like the multi-part series ones) will have training and test datasets. Some take seasonality into account, use weekly and monthly moving averages and more. It all depends upon the data and what you wish to accomplish with it.
Here is a great one on dealing with seasonality:
ruclips.net/video/wi8vdeiPwuc/видео.html
And here's another great one:
ruclips.net/video/UekOBfpu8m8/видео.html
Hope you find these video series on forecasting helpful.
Thank you.
@@techknowhow4802 I have a set of yearly data, and I wish to forecast for the next years. I tried fitting models for the entire data and then forecasting for the next values, but then I came across the use of training and test data, so I tried checking my models' performance on training and test data ad well. I only want for make forecasts for the next few years. Is modelling on the whole data set enough, or is partitioning into training and test data still needed?
@@techknowhow4802 For additional context, I only have data from 2000 to 2018, and I want to forecast for the next few years. Also, my data are not partitioned into months or weeks or days; my data only had years.
Hi, thanks a lot for posting the video. I am trying to follow it and forecast on my own data. However, it keeps showing me "object of type 'closure' is not subsettable". I typed in start = c(2017,3) in the code as my data starts in 3/2017. The dates are saved as "dates" in the excel file. Is this what is causing it? How can I fix this?
That almost always means you are using a wrong bracket type somewhere in your code. R thinks you are referring to a function or similar. Check out this page on what causes this error and how to fix it. Thank you. coolbutuseless.github.io/2019/02/12/object-of-type-closure-is-not-subsettable/
MAPE = 2.47. Does it mean the model was totally inaccurate?
ME RMSE MAE MPE MAPE MASE ACF1
Training set -0.01641758 3.346183 2.576781 -0.1203522 2.477265 0.5903279 0.09990205
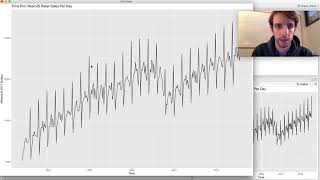
excuse me, I want to ask, where did you get frequency 52?
Thanks
I haven't looked at this one in a while, but 52 would be for weeks in a year.
Hello Sir! I am new in forecasting and R. I have these following questions:
1. If I build a model using auto.arima(data), I don't have to split my data (train and test) right? I just need to have the accuracy? the data is the test and train data sets itself right?
2. I have a data of sales of 200 product models for 1 month and 12 days in alternate days therefore, I have only 21 data points (sales) for 200 product models. How can I forecast them all in one go?
Thank you very much sir!
Auto arima is more of a super quick way to determine a forecast. It isn't always the best or most accurate method. This is why there are many algorithms and models out there. If you look at my other videos on arimas and forecasting, in particular, you will see me place several models up against each other for comparison. I also use other algorithms. You need to look at your data and be able to determine which algorithm would work best and provide you and your audience with results you can be happy with.
what packages must be installed in order to use auto arima?
Watch any of the auto arima or stock price forecasting videos on my channel. They all use auto arimas along with custom arima models with full code. Very easy to use and implement on any time series based dataset.
Hello Sir, how can we use this model for multiple items?
Yes, you would just have to change the code to loop through the models you wish to add or similar.
@@techknowhow4802 I am new user in this R tool, therefore, I am bad at loop. Can you explain clearly about this loop step?
Thank you Sir
@@techknowhow4802 Moreover, I do not why when I am running code, ARIMA (p, d, f ) is always (0,0,1)
@@phamvuquynhnhu2089 look up if/then, do/while, case if and for looping structures. You would most likely need that to add the code for whatever other models you are building.
@@phamvuquynhnhu2089 that would all depend upon your data. Every dataset is different. Is there seasonality you need to deal with or remove? Look at the longer forecasting video series on my channel. They deal with comparing multiple models, testing your data, and even identifying and removing seasonality.:)
How to interpret output data in R example 2018.85, 2019.305
I don't see a link to Kaggle
Where is the link for the backage please can you help me
The link for the libraries in R? Google install.packages() or just look at the early parts to any of my videos that show R programming. They will show you how to install the packages or libraries.
@@techknowhow4802 OK I will see it later, if I don't know how I will ask for your help 😢 I appreciate you answering my questions thnak you
how to save forecasted data in csv file?
You only need to aggregate next sentence at the end of code.... write.csv(forecast1, file = "anyname.csv")
Is this model with or without seasonality?
The auto arima by itself does not take seasonality (other campaigns, internal and external influences, trending and more) into account. There are numerous other similar videos that take seasonality into account on my video channel. Just search my videos for seasonality and arimas. Thank you. :)
my auto.arima return a model with (0,0,0) parameters :/
That all depends upon the data you are using. Every dataset is different. Take a hard look at it and see if it makes sense.
auto.arima() is not always the best model, thats why you need to look at ME, RMSE, MAE, MPE, MAPE, MASE, ACF1 and also AIC and BIC, and find the best combination, which will signal the best fit. The MAPE not exactly the measure what you need to look at, it will be very wrong model if you orienting to MAPE only. You may bee to experimenting with manual Arima() and choose the order (p,d,q). Note "A" is a typo here.
I was taught on campus using a diagnostic test model (p, d, q) checked one by one based on the truncated lag on acf and pacf, but it is a bit complicated if the truncated lot for a few lags
The lag 0 autocorrelation will always be 1