How to make a heatmap of differentially expressed genes in R (complex version).

HTML-код
- Опубликовано: 8 сен 2024
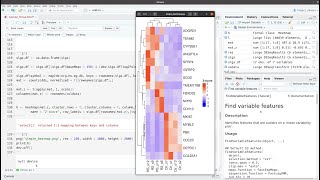
- Here I show you how to make a complex heatmap from significantly differentially expressed genes. I use output from Deseq2, but you can use DE data from other programs as well. This heamap is combined with gene row average expression and gene LF2 values.
I will show a simpler heatmap in an upcoming video.
Code available:
github.com/mou...


Thank you very much for your sharing! Your teaching really help me a lot!
But one question is that I can't find the file "ensemble_key_mapper" in your github
Nice!
Thanks!
Thank for your tutorial, however, could you show how to do the heatmap with a list of selected gene only?
appreciate the video! This could be because I didn't watch the video before this, but I'm wondering: did you just filter by genes where the adjusted p value is < 0.05 when comparing the control to one of your groups and then just filter by those same genes for all? I would assume the same exact genes would not come up as p < 0.05 if you had 5 different treatments with which you were trying to make a heatmap. probably depends on the nature of the experiment, but just wondering on how you filtered this on a higher level. Thanks
Hi. Good question. These genes used were filtered by their BH adjusted p values prior to the video (shown in previous Deseq2 video). It was just a simple control vs treated DE analysis. I think you are right: the same genes possibly would not have been significant in if different treatments were tested. But there is biological redundancy in many stress pathways. So hard to know without testing!
Very informative stuff man, do you mind sharing some of your scripts on Github ?
Thanks! Not at all, I will upload it later this afternoon.
Hi, sorry forgot to get around to it yesterday. Here it is: github.com/mousepixels/sanbomics/blob/main/tutorial_complex_Heatmap.Rmd
when i am trying to get log2 and mean value for each gene we are keeping I am getting the following error
mean
For those of you just starting out in R this may be a little too complex. I have a much simpler heatmap video here: ruclips.net/video/S2_FTg9kaZU/видео.html
I want to do heatmap for 4900 gene, the expression value are in excel, can I copy it to R without going through the whole process you started the video? it looks a bit tricky
Yup! Save it as a csv and you can open it up in R. It is a counts table? It can work, but normally you want a normalized count matrix.
I have a simpler heatmap video as well that is a bit more straightforward.
@@sanbomics Thanks a lot
thanks for your video, i am curious how to do the same for an experiment with 3 different treatment instead of two as shown in the video?
The only difference is how you select the genes to show on the heatmap, but making the heatmap will be the same. I used the top negative and positive genes between one comparison. With 3 groups you will have 3 pairwise comparisons. You can use the genes from all three comparisons to show on the heatmap.
Hi. Great videos. I am having real trouble with your rlog_out sequence. It doesnt seem to work on my R markdown - despite having all the same labelled files...? How can we trouble shoot this?
Can you paste your error message here?
How can I add my gene names ( from DEGs output) to my heatmap if I do not have ENSEMBLE ID...
What do you have? You can just do everything the same except specify the column with your identifiers instead of symbol that I have here
thank you. but how can I sort my heat map based on my marker genes per cluster. In articles they show a very nice heat map figure where the expression of genes per cluster goes like a line..how can I do that
Hi! I'm not exactly sure what you mean. Can you link to an example in a paper?
@@sanbomics Hey! It's okay I figured it out. Thank you
Thank you for your great video! I have a problem using the code in line 159 using assay function, it gave the error "Error in assay(rlog_out)[rownames(df), rownames(colData)] :
subscript out of bounds"
my rlog_out was from dds object that has 55416 rows and 10 columns, df is the significant genes with data that has 38 rows and 16 columns, and colData is the sample names and descriptions that has 10 rows and 3 columns, I checked colData row names are exactly the same as the first 10 columns in rlog_out and 38 genes in df is included in 55416 genes in rlog_out, but I cannot get a subset matrix with assigned 38 genes in 10 samples. Can you please help me with this?
Try [, rownames(colData)] and [rownames(df),] to see which one is giving you the error. Then look at it to see if it is what it should be. Let me know if that helps
@@sanbomics Thank you, I found its the rlog_out that somehow doesn't have the gene list as row names so that it didn't match the df file and colData file. I re-added rownames to the input file and it works!
Cool! Glad you figured it out
> col_AveExpr
There may have been an update. It looks like it is expecting a colors argument try looking at the manual for the function directly and see the required arguments.
@@sanbomics thank you for your reply, it seems like i was not closing the first argument
Hi I really appreciate your video and github script
maybe you can help me: I need to make several heatmaps, each one for a different set of genes. Maybe that info should be specified when you choose the top 25 genes, but since I choose by the symbol column, that is, specifying gene names or maybe it can also be by adding an ID to each rownames and selecting the numbers I need...
I appreciate any help
thank you
Yeah you can specify which genes you want to use. I use the top 25 but you can pick any you want.
Web page don’t work
thanks for letting me know. i fixed the link
Hey bro can you teach make heatmap for results from edgeR pls and differential with edgeR
Hey. The heatmap will be similar. You just need to export the matrix from your edgeR results. I've used edgeR only a couple times in my life. It works fine, but why not learn deseq2?
How would you do this when you have a 3 group comparison?
You can do 3 pairwise comparisons to get 3 sets of DE genes. Then include those 3 sets of significant DE genes in the heatmap identically to what we did here. The only difference being the inclusion of more genes.
@@sanbomics ah that makes sense so you do the union of all 3 comparisons then or?
Yeah union of the 3 sets of significant DE genes. This would be a typical summary of your data that people like to show. i.e., "look I did RNAseq and I have DE genes and my sample groups cluster together". But it really depends on what you are trying to show. You can pick any set of genes for the heatmap that you want.
@@sanbomics btw just executed all of that. Thank you so much for your help!
No problem!
Hi, I was wondering how could I change my heatmap to accomodate for data taken from TCGA biolinks? My main issue is the heatmap worked but did not print gene names, or indicate which were more upregulated as im looking at differentially expressed genes between sample types i.e primary tumour and normal tissue, and there is no indication of what sample type is what. Please let me know how i could change this! Thanks :)