The Supply Curve is the Marginal Cost Curve

HTML-код
- Опубликовано: 16 июл 2024
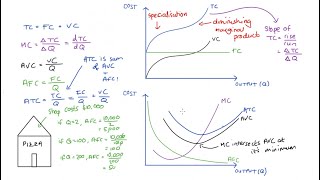
- Ever wondered what is the basis of the supply curve? Well, the answer is the supply curve is the marginal cost curve. In other words, the marginal cost of individual firms (or the horizontal sum of all market participants' marginal cost curves) is the supply curve. This video is made for 1st year college students or AP/IB Economics students. It focuses on foundational economic concepts.


Great job! You did one thing extremely well. You labeled the y axis as $/unit. Now your explanation makes sense. Most places seem to lable the y axis $, which is very ambiguous.
AMAZING! Can't express how excited I am when I get to 9:16 where I finally know why MC=Supply Curve. The illustration is excellent. Thank you, sir, for helping me with my Econ courses!!😀
this is absolutely amazing! if your brain gets hurt by watching this, just be patient, rewatch, repeat the idea by yourself, make your own examples, take a sheet of paper, take notes, and just play with the graph, and eventually this will make such a big sense. good luck you all.
AMAZING explanation! You just solved my confusion
You helped me pass my graduate econ final!!! High level educator.
This is literally amazing! I finally figured this whole thing out after this video
Thank you! I was so confused before.
Thank you for making this!
love this!
Thank you, sir.
Fantastic video!
Thank you sir, pretty clear now.
Thank you sir from India
Very helpful
MC is initially high then slopes down, then starts to slope up due to different constraints
To match the supply curve, are you disregarding all the cost before it starts rising?
This is the only part I can’t pick out.
Edit: this is accurate in the short term only.
Short term vs long term is a big distinguishing factor in micro.
In the short term, a company/firm produces a select output (which aggregated together with others forms supply), the supply curve is the same as the marginal cost curve. The firm chooses its quantity for which the price equals marginal cost, therefore the marginal cost curve of the firm is the supply curve of the firm. This is only in the short term when companies can’t change fixed cost etc.
This is ONLY TRUE when in perfect competition, when price sold = cost (with utility of zero). I don't know why this video doesn't mention that!
life changing, thank you so much
What’s the intuition for why MC is increasing? I would have thought it would decrease due to economy of scale.
I'm not sure what exactly you are talking about so my answer may be wrong. From what I understand MC will first decrease till one point and then start to increase later.
So, at first, if you hired a cook for example he would improve the production by producing 20 more pizzas, but as you hired more and more cooks they wouldn't improve the production as much, after a point another cook would only increaase the production a little because the room would be limited and so they wouldn't be able to work very well, so those few extra pizzas that were produced because of that new cook you added would have a higher marginal cost, since you would pay the cook 1k for example but only 4 new pizzas would be added to the production.
The supply curve shows the quantity that a company is willing to produce at a given price in order to maximize it's profit. If a pizzeria sold 8 euros for each pizza then it could produce so many pizzas so that the last pizza has a marginal cost of 8 euros. Having a marginal cost of more than 8 euros wouldn't be good for the company, since the creation of the pizza would cost more than it would be sold and thus it would not be profitable for the company to produce it. When we create the supply curve we do not use prices that are below the average variable cost, the reason is simple, if the price of the pizza was less than the average cost that each pizza needs to be made then we would not have a profit, since we would sell the pizzas less than they cost us to make them. So, in the supply curve we use the MC that's over AVC, which is why you see it only increase.
If however you are talking about how MC increases when the price for the tomatoes for those pizzas increased, then that's also logical, each pizza would cost a little more, so the marginal cost for each pizza would increase. If however the technology on the other hand improved, then those pizzas could cost less money to make, which would decrease the marginal cost.
Marginal cost decreases with volume
Butuh dia ngomong indo, biar aku tambah ngerti😭
Got a question. Isn't it that, The marginal cost is the extra revenue from the sale of an additional unit of product ?
Ty for your help!👍