00:04 Power BI is a robust business analytics platform 00:40 Excel is a versatile tool for data analysis, calculation and visualization. 01:17 Power BI offers more advanced cross-chart filtering capabilities and depth of analysis compared to Excel 01:55 Power BI excels in visually stunning interactive reports 02:34 Power BI is optimal for creating dynamic dashboards. 03:12 Excel and Power BI complement each other for the best data analysis experience. 03:48 Bi connector streamlines Power BI integration with Oracle 04:26 Streamlined data analysis with BI connector Crafted by Merlin AI.
For me, Excel is still the go-to choice for my day-to-day work. It's easy to understand and use, making it perfect for a wide range of tasks. While Power BI is great for more advanced data visualization and analysis, Excel's simplicity and versatility keep it at the top of my list for everyday use.
When your data is small with small user, absolutly pick Excel. When your data grown big and you want to serve more users, absolutly choose python with pandas.
@@nguyentrunghieu5626 excel has power query and power pivot so CAN handle millions of rows of data and handle them in a data model with star schema and DAX

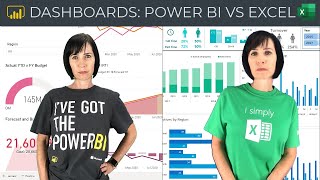


00:04 Power BI is a robust business analytics platform
00:40 Excel is a versatile tool for data analysis, calculation and visualization.
01:17 Power BI offers more advanced cross-chart filtering capabilities and depth of analysis compared to Excel
01:55 Power BI excels in visually stunning interactive reports
02:34 Power BI is optimal for creating dynamic dashboards.
03:12 Excel and Power BI complement each other for the best data analysis experience.
03:48 Bi connector streamlines Power BI integration with Oracle
04:26 Streamlined data analysis with BI connector
Crafted by Merlin AI.
For me, Excel is still the go-to choice for my day-to-day work. It's easy to understand and use, making it perfect for a wide range of tasks. While Power BI is great for more advanced data visualization and analysis, Excel's simplicity and versatility keep it at the top of my list for everyday use.
And for you, which one is better? Power BI or Excel? ⬇
Best of both worlds is Power Query! Interesting that you do not mention it.
Excel is still king for me
I only handle small data and small users.. so I pick Excel.
So excel is like level 1, power BI is level 2?
I am here just see how you compare the apples with the oranges....
You nailed it.
Nothing can beat Excel
Agree
When your data is small with small user, absolutly pick Excel. When your data grown big and you want to serve more users, absolutly choose python with pandas.
Interactive reports of PowerBI can be a big plus.
Because u dont use powrbi for big data, you cant explore data with miliion rows in excel, u don use many measure in powerbi 😂😂😂😂
@@nguyentrunghieu5626 excel has power query and power pivot so CAN handle millions of rows of data and handle them in a data model with star schema and DAX