I'm a packaging intern for a large food/beverage company, and as I'm learning more about QC and testing, I'm starting to actually used some of what I learned in my college statistics course and applying it to my work (I know right? Actually being taught important things in college, who knew?). I'm pretty rusty, so this explanation helps A LOT! Thanks for the explanation!
All of our stuff is done automatically, no need for QC, all we do is address the problem area when something comes up. It even sources best value to fix along with options for future fixes or restructuring any part of the life from dig to done. The dedicated computer even gives figures on changes by searching the newest along with the most reliable and runs hundreds of different economic downturn profiles of different industries to give us an advanced heads up so we can make adjustments to keep ahead of the trend. It's like having a fortune teller on staff, this thing literally replaced 17 $165k per year jobs and paid for itself in 31 business days.
In addition, in your first example, the average of the Process Variation (bell curve) is NOT centered between the specifications, so you should know that you must be using the Cpk formulas to calculate the Process Capability instead of the Cp one. Feel free to replay.
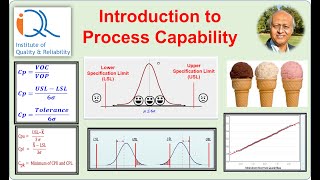
Data can be out-of-spec, yet Cp still be acceptable. Cp only compares allowable spread (width) to actual spread (width). Unlike Cpk, Cp does NOT take the mean into account. Think of Cp as this: Does this distribution have the Capability Potential? If Cp is 1.17, for example, this means that Cpk could be as high as 1.17. This example is for bilateral tolerances. There was no indication or statement that this is a situation with one specification. This example could have come from any process that can have negative values, thus the LSL = 0 is appropriate.
I think you are wrong, for instance, in your first example you calculated a Cp = 1.17 and the right extreme of the Normal Distribution Curve is clearly OUT OF SPEC! so your result of Cp=1.17 is wrong. You Professor Clearly got that result because you are also wrong in using the Cp formula to calculate the Process Capability for an UNILATERAL tolerance: LSL=0 and USL= 14 is an unilateral tolerance!, you should know that Cp formula only applies to calculate Process Capability for BILATERAL tolerances.
It has to do with Six Sigma. Our manufacturing process requires the distribution to have LSL located six deviations below the mean and USL six deviations above the mean. From the interweb: "Cpk 1.00 means that 2 700 PPM (0.27%) of the manufactured parts are out of tolerance, while Cpk 1.33 means that 63 PPM (0.0063%) are rejects. ... In concrete terms, Six Sigma means that the company's processes maintain six standard deviations from the mean value of the process to the nearest tolerance limit."
wow...good explaination sir,i want to ask something, i am learning this, and if i am not wrong if i draw a vertical line at graph(at 0.45sec part of video) then i notice that -3 value corresponds to 4.00 value of x axis , i hope that 4.00 on y axis is just a data point , so any data assumed that has minimum value=4, maximum value=16 and overall average=10 , am i right ?? please do answer..i will be thankful...
My question is that in 6 sigma the graph is used of +/- 6 sigma & for Cpk graph is used of +/- 3 sigma as per formula of X axis what is the difference . Please sir answer it.
Cpk shows the capability of a process whether or not its mean is exactly centred between its specification limits. Now the main difference is the PPk provides a more long term view by using overall standard deviation and considers swings and drifts in subgroups, also accounting for variation, while the cpk which uses the "within standard deviation" doesn't consider drifts and shifts within the subgroup and presumes there's no variation in the subgroups. It only shows the capability of a process to produce parts that fall within the spec limits if there isnt variation in the sub groups
lromeroyt Dear it's two different thing b/w cp & cpk. cp clear that is we are capable for that process .Cpk tells you how much me are capable for this process .cpk is an Index .


![Megan Thee Stallion - Mamushi (Remix) [feat. TWICE] [Official Audio]](http://i.ytimg.com/vi/5c0_u9PsrsQ/mqdefault.jpg)


Thank you very much for this video. This is quite helpful for my process engineering interview at a major tech company.
I'm a packaging intern for a large food/beverage company, and as I'm learning more about QC and testing, I'm starting to actually used some of what I learned in my college statistics course and applying it to my work (I know right? Actually being taught important things in college, who knew?). I'm pretty rusty, so this explanation helps A LOT! Thanks for the explanation!
This comment is nine years old. I hope yoy are crushing it out there!
Just came across this....very good...thanks...12 years later!
Fantastic, easy to understand explanation! My six sigma course lectures couldn't explain it this well.
Thanks so much Professor. This will help me more in my job. I am eager to see another useful video from you.
All of our stuff is done automatically, no need for QC, all we do is address the problem area when something comes up. It even sources best value to fix along with options for future fixes or restructuring any part of the life from dig to done. The dedicated computer even gives figures on changes by searching the newest along with the most reliable and runs hundreds of different economic downturn profiles of different industries to give us an advanced heads up so we can make adjustments to keep ahead of the trend. It's like having a fortune teller on staff, this thing literally replaced 17 $165k per year jobs and paid for itself in 31 business days.
Its very useful for me to implement our process and train for our engineers
thanks. you have a very clear way of explaining.
well understanding, no more confuse now. Thank you v much.
Thanks so much, this video is very informative. In english, that means you are AWESOME
many thnks for making this video....truly useful
Clear and concise!
Well Explained
Thanks, very good presentation
Thank you for understandable video.
thank you professor
Really great video,thank you
thnku very much for this amazing video , all doubt cleared
JATINDER SINGH. I don't feel like watching it whats cpk ?😂😭😭
thanks for making this easy
Watching in 2022, Thank you so much Sir!!
Great video thank you
Very simple, I like it
In addition, in your first example, the average of the Process Variation (bell curve) is NOT centered between the specifications, so you should know that you must be using the Cpk formulas to calculate the Process Capability instead of the Cp one. Feel free to replay.
Data can be out-of-spec, yet Cp still be acceptable. Cp only compares allowable spread (width) to actual spread (width). Unlike Cpk, Cp does NOT take the mean into account. Think of Cp as this: Does this distribution have the Capability Potential? If Cp is 1.17, for example, this means that Cpk could be as high as 1.17.
This example is for bilateral tolerances. There was no indication or statement that this is a situation with one specification. This example could have come from any process that can have negative values, thus the LSL = 0 is appropriate.
great preso / easy to grasp
thanks much!
Thank you Professor!
I think you are wrong, for instance, in your first example you calculated a Cp = 1.17 and the right extreme of the Normal Distribution Curve is clearly OUT OF SPEC! so your result of Cp=1.17 is wrong. You Professor Clearly got that result because you are also wrong in using the Cp formula to calculate the Process Capability for an UNILATERAL tolerance: LSL=0 and USL= 14 is an unilateral tolerance!, you should know that Cp formula only applies to calculate Process Capability for BILATERAL tolerances.
Thank you very much Sir! You are awesome!
This is the video i was searching for ;)
hey, I have a question. Where does the CpK of 1,33 come from? I never found or got a proper explanation how it was calculated?
It has to do with Six Sigma. Our manufacturing process requires the distribution to have LSL located six deviations below the mean and USL six deviations above the mean.
From the interweb:
"Cpk 1.00 means that 2 700 PPM (0.27%) of the manufactured parts are out of tolerance, while Cpk 1.33 means that 63 PPM (0.0063%) are rejects. ... In concrete terms, Six Sigma means that the company's processes maintain six standard deviations from the mean value of the process to the nearest tolerance limit."
1,33 is the result of 8Sigma/6sigma
wow...good explaination sir,i want to ask something, i am learning this, and if i am not wrong if i draw a vertical line at graph(at 0.45sec part of video) then i notice that -3 value corresponds to 4.00 value of x axis , i hope that 4.00 on y axis is just a data point , so any data assumed that has minimum value=4, maximum value=16 and overall average=10 , am i right ?? please do answer..i will be thankful...
How to interpret Cpk value? More detail please?
How do you calculate that 2.28% out of spec. using Cp?
Marty Graw. Love it! ;)
My question is that in 6 sigma the graph is used of +/- 6 sigma & for Cpk graph is used of +/- 3 sigma as per formula of X axis what is the difference . Please sir answer it.
very one tailed explanation....
this helps.. Thanx sir
Thank you sir! very helpful!
Awesome!!
Thanks lot..
Niceeee thank you for this video!
very helpful
impressive sir..!
Please on the diagram I saw 2.29%. Please sir can u explain? Am having difficult over there. Thanks
THanks, Sir
brilliant thanks!
Professor, can you please explain the difference between CPK and PPK
Cpk shows the capability of a process whether or not its mean is exactly centred between its specification limits. Now the main difference is the PPk provides a more long term view by using overall standard deviation and considers swings and drifts in subgroups, also accounting for variation, while the cpk which uses the "within standard deviation" doesn't consider drifts and shifts within the subgroup and presumes there's no variation in the subgroups. It only shows the capability of a process to produce parts that fall within the spec limits if there isnt variation in the sub groups
So...how does each single digit on your z line become 2?
2 is the standard deviation. The numbers on the Z line represent sigmas. Each sigma changes by 2. 3 sigma above and 3 sigma below.
it is good doctor but still nt clear for me when Cpk is= .67
what does that mean in term of prodcution percentage %
thank you sir
so why is Cp needed? Just calculate Cpk all the time. Is there a reason? thanks!
lromeroyt Dear it's two different thing b/w cp & cpk. cp clear that is we are capable for that process .Cpk tells you how much me are capable for this process .cpk is an Index .
good, thanks.
soo good...
Thank you! :)
thanks
Very helpful thank you :)
How it is 99.73 %?
Didn't understand this part.. other things are awesome..!!
Empirical Rule
sagar rakhe 3 standard deviations in either direction together holds 99.73% of the curve.
In college we have on the teacher's Pdf notes saying that CPk is the lowest value of ZL/3sigma or ZU/3sigma....? Is that the same?
Yes, basicly.
What?
funny six sigma haha like the methodology on learning in class along with calculating cp and cpk in high school that is
We did this at Motorola in the early 80's, master black belt and 3 year champion status yea'
مةتىااناحمخ
DONT UNDERSTAND HEAD OR TAIL OUT OF IT... VERY BAD EXPLANATION......
Learn English, and pay attention... its a very clear and good explanation.
blue LICKS, watch ur mouth..... otherwise...licks as what u called....
just keep to your self....
very useful
thank you Sir