Thanks for tutorial, I had vision I was suppose to work with Power bi and excel and all of sudden I am doing this like I have done it before. I never even heard of this app until I meet someone at my new job that was using it, then that triggered my vision. I love power bi and to become data analyst. I have been working as IT support in a few warehouses over 20 years. I will watch all your videos.
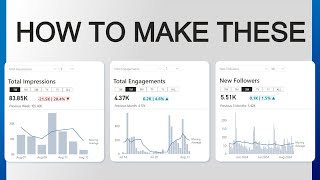
This somewhat seems complex. I was talking about the usage of new KPI card which has some great in-built features in it. But anyway thanks for the tutorial :)
First of all thank you very much for watching the video. Yes, there is a way of using the New Card visual, but that would involve using svg images and creating the measure for those would be even more complex, and I've tried to keep this tutorial accessible for the beginners as well. But, as we speak I am recording a video on how to create a KPI card with the sparkline to the right of the KPI, and maybe you will enjoy that one as well. It will be live around Thursday, next week.
Yes, definitely. I was so absorbed by using the negation of the negative that I missed the best (and most elegant) solution. Thank you for pointing it out!
This is very weird, because it is a standard line chart, and all I did was to o use a custom a title and subtitle. It should work with the most recent version of Power BI Desktop.
I like your approach! Looking at your code I have some doubts with correct leap year handling. Is there a reason why you avoid DAX time intelligence functions to do the date range calculations?
Thank you. I addopted this way of calculating the YoY % because my dataset does not include sales data for the whole year, and I've noticed that SAMEPERIODLASTYEAR does not consider that. I have noticed that when you have incomplete years and you want to return a year over year growth for the exact period of both years (anything other than that I don't consider as YoY), then the regular dax functions return wrong results. Yes, I could have used DATESBETWEEN to set the dates range, but (personally) I believe it does not make that much of a difference. I may very well be wrong on this :)


Excellent tutorial - thanks
You are welcome! I'm very happy that you enjoyed it!
Thanks for tutorial, I had vision I was suppose to work with Power bi and excel and all of sudden I am doing this like I have done it before. I never even heard of this app until I meet someone at my new job that was using it, then that triggered my vision. I love power bi and to become data analyst. I have been working as IT support in a few warehouses over 20 years. I will watch all your videos.
Thank you very much! I'm glad you enjoyed this tutorial, and I know this is the beginning of a very beautiful journey for you!
Really well done!
Thank you very much 😊.
I'm very happy that you enjoyed it.
excellent and very useful
I am glad you think so and I hope it will give you a starting point to create your own KPI cards.
Where do I get the date Table. I got total sales by month on order date table. seems to work that way too anyways
In this video you can find the M code that I used:
ruclips.net/video/7qaIavKCaoI/видео.htmlsi=25EG71sHgiYBK43Y
It should be the final chapter.
This somewhat seems complex. I was talking about the usage of new KPI card which has some great in-built features in it. But anyway thanks for the tutorial :)
First of all thank you very much for watching the video.
Yes, there is a way of using the New Card visual, but that would involve using svg images and creating the measure for those would be even more complex, and I've tried to keep this tutorial accessible for the beginners as well.
But, as we speak I am recording a video on how to create a KPI card with the sparkline to the right of the KPI, and maybe you will enjoy that one as well. It will be live around Thursday, next week.
@@MMS-PowerBI Thank you so much Stellion 🧿
How is DATE TABLE created?
I have a video on the channel where you can see how to get the exact same date table.
This is the link: ruclips.net/video/7qaIavKCaoI/видео.html
Brilliant thank you
You're very welcome!
I'm glad you enjoyed it.
14:13 or you just use ABS(YoY %) instead.
Yes, definitely. I was so absorbed by using the negation of the negative that I missed the best (and most elegant) solution.
Thank you for pointing it out!
How to add this ?
What do you need to add and where?
@@MMS-PowerBI when I add this visual in my dashboard. It is not opening
This is very weird, because it is a standard line chart, and all I did was to o use a custom a title and subtitle. It should work with the most recent version of Power BI Desktop.
I like your approach! Looking at your code I have some doubts with correct leap year handling. Is there a reason why you avoid DAX time intelligence functions to do the date range calculations?
Thank you.
I addopted this way of calculating the YoY % because my dataset does not include sales data for the whole year, and I've noticed that SAMEPERIODLASTYEAR does not consider that. I have noticed that when you have incomplete years and you want to return a year over year growth for the exact period of both years (anything other than that I don't consider as YoY), then the regular dax functions return wrong results.
Yes, I could have used DATESBETWEEN to set the dates range, but (personally) I believe it does not make that much of a difference. I may very well be wrong on this :)