Just found this video and I just wanted to say, your videos are so helpful and friendly. Your voice is very welcoming and you really did save me a lot of time I would have spent trying to figure out how to use my calculator on my own. Thank you, Robert I wish you the best!!!
I know I’m a bit late on this, but this video helped me out sooooo much! I’ve been trying to find videos like this but they’re so hard to find. Thank you soooo much for your help you are an amazing teacher!
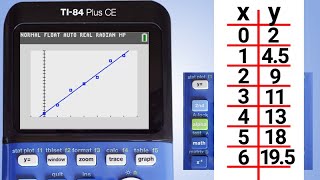
tnx 4 sharing! i never plotted points using STAT B4 so it helped immensely. FYI - there seems to be an inconsistency at 2:25 ? the data inputed is -4 but the accompanying overlay (in red) is displayed as +4
Thank you for the Video! Is there a way to find the slope of any given line that is graphed by plotting points? For example we need a line that goes through certain points and all we know is the points. I do know how to find it easily on paper but just interested if that is possible with this calculator. I do have the TI-84 Plus CE.
My calc is giving me a graph that's just a straight line w/ticks. There are no points plotted even though I put them in. I put it on graph 1 and made it the right kind of graph. I'm so confused!! DX
Is there a way to assign names to each points, for example: point A, point B etc so you can easily see which of your points is above or below a certain line


This is so helpful I cant even say. I had to do this for an algebra test and I didn't know how to use it and I watched this and it helped me pass.
Same
Im cramming because got a test tmrw on statistics, and i forgot i didnt know how yo graph on the calculator.
Just found this video and I just wanted to say, your videos are so helpful and friendly. Your voice is very welcoming and you really did save me a lot of time I would have spent trying to figure out how to use my calculator on my own. Thank you, Robert I wish you the best!!!
thank you only video I FOUND ON THIS
Rob!! You are the BEST! You have helped me IMMENSLEY!! Thank you for Sharing!! I would be LOST with OUT YOU!
Great! I am glad that this video has helped you. Thanks for watching!
Thank you
Thanks, I needed to know this before my STAAR test.
Excellent explanation and was exactly what I needed -- thank you.
thank you so much. ive been looking everywhere just to learn this one thing and you made it so simple and so easy. thank you very much!!!
I know I’m a bit late on this, but this video helped me out sooooo much! I’ve been trying to find videos like this but they’re so hard to find. Thank you soooo much for your help you are an amazing teacher!
Straight to the point and very helpful. Bless you, sir. Subscribing and you'll be my calculator guy from now on.
Thank you so much! This was super helpful learning to navigate this calculator
Thank you so much, helped me alot with my math task.
This video is so helpful thanks so much for this awesome video
Thank you so much Robert. You saved my butt
Thank you!
Just got this calculator for a class I’m taking, that’s for the help
tnx 4 sharing! i never plotted points using STAT B4 so it helped immensely. FYI - there seems to be an inconsistency at 2:25 ? the data inputed is -4 but the accompanying overlay (in red) is displayed as +4
Amanda, thank you for pointing out that input error. I need to be more careful in the future. Thanks!
Thank you so much this video was so helpful!
Thank You for this video
This is very helpful thank you! :)
thank you so much.
Thank you!!
Thank you for the Video! Is there a way to find the slope of any given line that is graphed by plotting points? For example we need a line that goes through certain points and all we know is the points. I do know how to find it easily on paper but just interested if that is possible with this calculator. I do have the TI-84 Plus CE.
My calc is giving me a graph that's just a straight line w/ticks. There are no points plotted even though I put them in. I put it on graph 1 and made it the right kind of graph. I'm so confused!! DX
Thank You So Much😊
thank you!
Is there a way to assign names to each points, for example: point A, point B etc so you can easily see which of your points is above or below a certain line
Is there a way to graph with an unknown x and y value?
Need to know how do you make it graph L1 and L3
How do I graph two lines?
OH TYSM
Thank you
Thank you!
Thank you!