What's funny is that on this exact moment of the video I thought exactly the same, went to the comment section to write it and I see that's its already there haha
Would you please do videos on the Weibull Distribution and Triangular Distribution. All of your explanations are fantastic and I haven't found any good videos on those distributions to date.
Thank you for the amazing work you are doing here. I would like to make a request, if I may. Can you inform us a bit more about calculus and how it is relevant for learning statistics, particularly probability distributions? Thank you!
My first month of Prob. and Stat. lectures and these concepts were still lost on me. I now feel such a wave of understanding that the euphoria can hardly be contained. Thank you!
@@zedstatistics Love how humble you are; read your papers on biostatistics the other day. Not that I understand all (or much) of it, but massive respect and great channel! Much love. Please make many more videos!
I have just watched half the video and can't hold myself back from Thanking you for putting a video with such a clear explanation. I had watched 7-8 videos on You Tube before I found this..Simply Superb
Can't believe 16 minutes back I was struggling with this topic. Thank you for this great lecture! It was so easy to follow. This was my first video on this channel and I didn't even give a second thought and just subscribed.
You precede me by 3 months. You were stuck 3 months back where I was 16 minutes ago. And in spite of this being the only video I have watched, I too subscribed to the channel, with no second thoughts.
I hate this course so much, my lecturer sucks because she will explain the very basic understanding of the theory and then give a bunch of complicated examples as a task the next day😒😒 so thank you for making this video❤
So grateful for your videos. Your teaching style is so natural and suitable for 'stats idiots' like me :) I'm probably the one who's always raising her hand to ask a question but the teacher ignores/misses my raised hand. Most stats videos I've watched assume the viewer understands everything then jumps to the next level. But you actually take the time to make sure your point is understood before moving on. Thank you so much for your superb teaching!
Absolutely adore your videos, especially the series on distributions. I’m sure these are in the works, but could you do videos on the Geometric, Beta, Gamma, Weibull, Pareto, Logistic, and their inverses of those that have them? Really get into the guts of each...
got much planned this year! Hope to get to these but they do take a while :) Have got this comment screenshotted and will give you a shout out when I hit the whole Beta-Gamma functions :)
Why don't this channel have more subscribers?! This is the best statistic video I've ever watched on ytb. It cleared my doubts halfway through the video. Thank you so much for this. You're really good at explaining things easily and clearly.
Had to write a comment to thank you for this video, we covered this in my first year stats unit, and the lecturer has delivered the entire content of this part of the unit almost entirely in maths notation and mathematical definitions that left me puzzled and wondering whether I had registered for the wrong class, in the 16 minutes from your video I understand the content far better then I did after watching hours of lectures on the exact same topic
I have to say; I've had professors throw around the terms PDF, PMF and CDF in class. While I understood that PMF referred to discrete functions and PDF to continuous functions, I never really understood the relationship to CDF until watching this video. Thank you so much, this was excellently done.
I think your ability to explain this concept in such a succinct and clear way really speaks volumes about your grasp on the concepts - it's just as they say; you don't understand a concept until you can explain it really well to someone else. super helpful video!!
well done mate! very few people have art of explaining things perfectly (method, pitch voice, pace, graphics and more) and of course it comes naturally. You are one of them. keep it up!!
Seriously, one of the most I liked video.... Thanks for this wonderful job...🙇♂️ தமிழ்லயும் இந்த மாதிரி சொல்லிகுடுக்க ஆசிரியர்கள் இருந்தால் நல்லாருக்கும்.....😒😒
I’ve been viewing a lot of stats videos on RUclips and there are a lot of very talented teachers that can explain this tricky subject. But, this channel is the very best of the best!
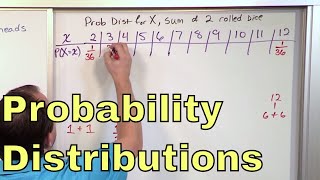
1:00 pmf 1:05 - 1:10 which is just a simple way of saying the probability of each discrete outcome 1:15 - 1:24 pdf which we use for continuous variables 1:37 - 1:44 now be careful about pdf because I have called this whole video probability distribution functions 1:44 - 1:53 some people might call all(inclued pmf ,pdf ,cdf) of these together as pdf which does get a bit confusing 1:54 - 2:02 i use pdf to mean the probability density function which relates solely to continuous variables 2:09 - 2:23 now both discrete and continuous variables can construct what is called a cumulative function
Awesome, Superb, liked you explanation and subscribed....By the way, if I use Monte Carlo Normal Distribution to predict the stock price move, do you think how accurate this method will be, if it is not very satisfied because of the flat tail, which method do you think it will be the best bet to predict the price.. thanks again! Alex
Holy crap this is perfect. Thank you so much. Once I hit this point in statistics, I have felt lost. The more videos covering this type of stuff, the better!
Thank you! I'm taking mathematical statistics right now and were covering CDF and PDF using differentiation and integration and I finally understand. Thanks again!!!
Hey man, I would like to take a minute to thank you for your videos. They are so clearly explained, to the point explained in short videos. Really helped in gaining a good grasp of the concepts intuitively and please continue this work of helping students like me.
Exponential distribution (CDF looks exponential) is a common way to model reliability. If I would now do some Monte Carlo simulation with inverse transform sampling so that I got a group of failure times as an output, do I already see the outcome from that plotted PDF i.e. the higher the Y-axis value peak the more failure times around that time (X-axis) I would expect? The PDF of that exponential function is a decreasing curve but the hazard rate is constant. Why do we call that memoryless (yes, the hazard is constant) even though we would get more failure time values according to the PDF in the beginning (because it looks to be a decreasing curve)?
This video was worth it just for the insight that normal distributions graph as S-curves when graphed cumulatively. I've done a lot of thinking this year about S-curves as a problem-solving heuristic, yet was wondering how and why they emerged mathematically...this is our answer.
At 7:09 onwards, shouldn’t the values of the y-axis of the PDF diagram be 10 times the values shown? That is, the curve’s peak is ~0.4 (not ~0.04) at the mean of the Height (165cm)?
Dear Mr. Justin I need your help and would you make a video on : Stochastic Processes: Definition and property of poison Process and Exponential Distribution, Computing exponentials, Renewal Process Results and Markov Chain Results
Thank you very much. What are you doing is changing my perspective about the concept of learning. I will definitely recommend your channel. I wish you the best 🤍
Thank you so much for this. What is the intuition of the gradient of the CDF? With the discrete probability example I understand the Y axis shows the probability. Does the gradient of the CDF show the probability on the PDF? Thanks.
Not sure if you read comments on old videos. looking for advice please. I know nothing about maths or excel until a year or so ago (I am 70 now). I have been using Poisson to predict an event. Imagine a coin. Head, Tails and it can land on its edge. But each time the weight of the coin is heavier on the head side, or tail side or even the edge. Those variables are always known. What is the best type of probability distribution I should be using to predict head,tail or edge. I have watched your video series and now just think that Poisson is not the best fit. Any help would be appreciated. Thank you
What a GREAT intuitive explanation of distribution functions! I can tell your videos will come in useful throughout my Probability course! (and statistics course once that comes along) :)
Very clear explanation thanks. Just curious, how does one determine the height minimum of 140 and maximum of 190? Using known records for short and tall? Also, I guess we are assuming that women's height distribution is about normal? I've always wondered how the population distribution for something like height is determined. Is it determined through sufficient experiments?
Thank you very much.... I have my test tommorow and now I am clear with the concepts.... This presentation was much more clear than my lecture attend clg ... Keep dng such videos on statistics... It helps us students a lot.. thankyou again ❤❤
Perfect explanation.... but would be cherry on the cake if u add in some applications and examples n how to use the y-axis values in PDF and CDF in real-time Data related applications Thank you!
You usually don't use the y-axis value of a PDF directly, in an application. You'd be asking the question of what is the probability that the random variable is exactly 1, for instance. It's a meaningless question for a continuous random variable, because the probability of the variable being exactly any given number is infinitesimal. You need to multiply (or rather integrate) the PDF across a finite interval of the random variable, for the PDF to have a meaning of probability being within that interval. It is the integral of a PDF (i.e. the CDF) that has a meaningful concept. One application where you may use the PDF's y-axis value directly, is when finding the overlapping area between two probability distributions. You find the point where the two PDF's intersect, and use that as the upper bound of integration when evaluating one CDF, and the lower bound of integration when evaluating the other CDF.
I'm so glad I found these videos! I am tasked with implementing some of these techniques in code. Deer in front of headlight situation without much of a mathematics background... Not anymore!!
I have subscribed! There is coherence, clarity and fluency. Everything in this video works together for the betterment of your resource. Thank you! I suggest for a video giving real-life examples and situations that will further explain the topic. By the way, I love your introduction stating that it is more intuitive.
thank god you were there! I was almost halfway through my portions suddenly in book they used PDF achronym dk what they were refering. First few min through your vid my doubt got cleared. thankyou
you are amazzzzzzzzzzzzzzzzzzzzzzzing teacher. God bless you!!!!!!! I pray to god, you live a long long life more than 200 years of life, so that you can make future generation students life easier.


"you cant roll a 7 on any dice I've seen" I see someone who has never played D&D before
. Thank for the video btw.
haha. No d20s in my games cupboard, unfortunately.
First thing I thought too! LOL
I thought that instantly
What's funny is that on this exact moment of the video I thought exactly the same, went to the comment section to write it and I see that's its already there haha
@@kamilnowak4329 You perfectly described what just happened to me! Ok back to the video now.
bloody rippa mate. you really got the knack of explaining rather than just telling.
ridgy didge feedback right here^^
Amazing.. Pretty easy to understand.. Thank you so much
A teacher with the vibe
Would you please do videos on the Weibull Distribution and Triangular Distribution. All of your explanations are fantastic and I haven't found any good videos on those distributions to date.
Wonderful video. Thank you!
THANK YOU SO MUCH
great presentation!
Thank you for the amazing work you are doing here. I would like to make a request, if I may. Can you inform us a bit more about calculus and how it is relevant for learning statistics, particularly probability distributions? Thank you!
Thanks; loved this ❤
Thank you ❤️
thank you so much
Could you make a video about how to find out what is the distribution of our data? Thanks.
When you are calculating CDF using integral we are talking about area under CDF curve, correct?
😊thankyou
Nice
My first month of Prob. and Stat. lectures and these concepts were still lost on me. I now feel such a wave of understanding that the euphoria can hardly be contained. Thank you!
Everything in this video is perfect
Examples : we can easily imagine
Video : perfect
Voice :not having high pitch
Everything is amazing
One of the best explanation of PDF, CDF, PMF across RUclips. Your channel is so underrated. This video deserves million views.
Oh but it's worth it just for this one view. Thanks Azan!
@@zedstatistics Love how humble you are; read your papers on biostatistics the other day. Not that I understand all (or much) of it, but massive respect and great channel! Much love. Please make many more videos!
soooo true
Can u explain to me, where did he fine all those number out of 1/6 probability pl?
This video now has one million views!!
I have just watched half the video and can't hold myself back from Thanking you for putting a video with such a clear explanation. I had watched 7-8 videos on You Tube before I found this..Simply Superb
Can't believe 16 minutes back I was struggling with this topic.
Thank you for this great lecture! It was so easy to follow. This was my first video on this channel and I didn't even give a second thought and just subscribed.
You precede me by 3 months. You were stuck 3 months back where I was 16 minutes ago. And in spite of this being the only video I have watched, I too subscribed to the channel, with no second thoughts.
You precede me by a year and I share the same sentiments. I, too, will now subscribe.
lol. me too. now i gotta find differentiation and integration examples though
Such a great and easy going explanation.. go on, please.
I have been through almost 10 videos to understand the y-axis of a pdf and this nailed it!
I hate this course so much, my lecturer sucks because she will explain the very basic understanding of the theory and then give a bunch of complicated examples as a task the next day😒😒 so thank you for making this video❤
So grateful for your videos. Your teaching style is so natural and suitable for 'stats idiots' like me :) I'm probably the one who's always raising her hand to ask a question but the teacher ignores/misses my raised hand. Most stats videos I've watched assume the viewer understands everything then jumps to the next level. But you actually take the time to make sure your point is understood before moving on. Thank you so much for your superb teaching!
that transition from stats to calculus was super smooth and intuitive. Z, we NEED a calculus tutorial from you. It would make school SO much easier.
You shud refer to Professor Leonard
Absolutely adore your videos, especially the series on distributions. I’m sure these are in the works, but could you do videos on the Geometric, Beta, Gamma, Weibull, Pareto, Logistic, and their inverses of those that have them? Really get into the guts of each...
got much planned this year! Hope to get to these but they do take a while :) Have got this comment screenshotted and will give you a shout out when I hit the whole Beta-Gamma functions :)
Why don't this channel have more subscribers?!
This is the best statistic video I've ever watched on ytb. It cleared my doubts halfway through the video. Thank you so much for this. You're really good at explaining things easily and clearly.
Spread the word, PL. It's the little channel that could.
Thank you so much mate! Like you said, very intuitive. This style of teaching really works for me!
Classic way of presenting and teaching. Absolutely loved it.
Thanks a lot for sharing a valuable piece of knowledge. Love from india ❤
Had to write a comment to thank you for this video, we covered this in my first year stats unit, and the lecturer has delivered the entire content of this part of the unit almost entirely in maths notation and mathematical definitions that left me puzzled and wondering whether I had registered for the wrong class, in the 16 minutes from your video I understand the content far better then I did after watching hours of lectures on the exact same topic
What is that slope in PDF is indicating?
This is beautiful, honestly. Thank you soo much.
I have to say; I've had professors throw around the terms PDF, PMF and CDF in class. While I understood that PMF referred to discrete functions and PDF to continuous functions, I never really understood the relationship to CDF until watching this video. Thank you so much, this was excellently done.
I think your ability to explain this concept in such a succinct and clear way really speaks volumes about your grasp on the concepts - it's just as they say; you don't understand a concept until you can explain it really well to someone else. super helpful video!!
well done mate! very few people have art of explaining things perfectly (method, pitch voice, pace, graphics and more) and of course it comes naturally. You are one of them. keep it up!!
Sir do you have any video on Time series analysis or algorithms that are using in TS, such as auto-regression.
Statistics makes so much sense when you explain..thank you! Please could you do a video on Limits especially the Central limit therom?
Seriously, one of the most I liked video.... Thanks for this wonderful job...🙇♂️
தமிழ்லயும் இந்த மாதிரி சொல்லிகுடுக்க ஆசிரியர்கள் இருந்தால் நல்லாருக்கும்.....😒😒
wow one of the best videos I ever have seen. Thank you for taking the time to explain to us.
I’ve been viewing a lot of stats videos on RUclips and there are a lot of very talented teachers that can explain this tricky subject. But, this channel is the very best of the best!
that solve all my confusion thank you very much
1:00 pmf
1:05 - 1:10
which is just a simple way of saying the probability of each discrete outcome
1:15 - 1:24
pdf which we use for continuous variables
1:37 - 1:44
now be careful about pdf because I have called this whole video probability distribution functions
1:44 - 1:53
some people might call all(inclued pmf ,pdf ,cdf) of these together as pdf which does get a bit confusing
1:54 - 2:02
i use pdf to mean the probability density function which relates solely to continuous variables
2:09 - 2:23 now both discrete and continuous variables can construct what is called a cumulative function
Awesome, Superb, liked you explanation and subscribed....By the way, if I use Monte Carlo Normal Distribution to predict the stock price move, do you think how accurate this method will be, if it is not very satisfied because of the flat tail, which method do you think it will be the best bet to predict the price..
thanks again!
Alex
Hi... Would you please also cover inverse cumulative distribution function?
inverse is going to 1-CDF function ie 1-P(X)
I have been searching for hours and I am so glad I found your video. Best explanation of PDF, PMF and CDF hands down.
Sir,
Your knowledge, methods and presentations are awesome.
Pls tell me which application software you use for your presentation?
Pls pls reply.
I use Excel believe it or not! Video editing done on Camtasia.
That moment when your lecturer can't explain this in 1 hour and you do it in 16 minutes...
Holy crap this is perfect. Thank you so much. Once I hit this point in statistics, I have felt lost. The more videos covering this type of stuff, the better!
subscribed immediately. You're the best, thank you so much.
Most detailed and explained lecture I have seen . Big ups
You are doing a great service to those who got lost in understanding statistics. Keep up the good work.
You're the first youtuber i saw create a section on the video progress bar and it looks neat.Keep up the good works 💪🏽💪🏽💪🏽
Great video dude. Can I ask you a question: did u use excel to do the graphs?? Thanks bro.
The answer is yes. I realized after watching the whole video. Thanks anyway.
Thank you! I'm taking mathematical statistics right now and were covering CDF and PDF using differentiation and integration and I finally understand. Thanks again!!!
Clearest explanation I've encountered so far! Thank you!
I am not from mathematics background. this video beautifully simplified such a complicated issue. thanks. God bless you
Thank you for making this video! The best I’ve seen on PDF, CDF. That last bit was pure gold 👏
Hey man,
I would like to take a minute to thank you for your videos. They are so clearly explained, to the point explained in short videos. Really helped in gaining a good grasp of the concepts intuitively and please continue this work of helping students like me.
Hey Justin! Very good content! Can you also do more Distributions just like, Gamma-Distribution, Beta-Distribution and Weibull-Distribution?
Didn't cover as much as I thought, but still a very effective video for basic. Clear cut and understandable!
beautifully explained, keep going on all statistical concepts
Can you please explain ANOVA
Something in your video made me focus more while learning. Thanks!
Oh my god I never write comments but let me tell you, this video literally saved my life thank you so much, wonderful explanation
Exponential distribution (CDF looks exponential) is a common way to model reliability. If I would now do some Monte Carlo simulation with inverse transform sampling so that I got a group of failure times as an output, do I already see the outcome from that plotted PDF i.e. the higher the Y-axis value peak the more failure times around that time (X-axis) I would expect? The PDF of that exponential function is a decreasing curve but the hazard rate is constant. Why do we call that memoryless (yes, the hazard is constant) even though we would get more failure time values according to the PDF in the beginning (because it looks to be a decreasing curve)?
Finally I understand this! And it seems pretty simple, when someone explains it well. Thank you.
This video was worth it just for the insight that normal distributions graph as S-curves when graphed cumulatively. I've done a lot of thinking this year about S-curves as a problem-solving heuristic, yet was wondering how and why they emerged mathematically...this is our answer.
thanks!!! i was searching this kind of explaination but most of those are directly doing examples,problems
Amazing explanation loved it
At 7:09 onwards, shouldn’t the values of the y-axis of the PDF diagram be 10 times the values shown? That is, the curve’s peak is ~0.4 (not ~0.04) at the mean of the Height (165cm)?
Dear Mr. Justin
I need your help and would you make a video on : Stochastic Processes: Definition and property of poison Process and Exponential Distribution, Computing exponentials, Renewal Process Results and Markov Chain Results
Thank you very much. What are you doing is changing my perspective about the concept of learning. I will definitely recommend your channel. I wish you the best 🤍
Thank you so much for this. What is the intuition of the gradient of the CDF? With the discrete probability example I understand the Y axis shows the probability. Does the gradient of the CDF show the probability on the PDF? Thanks.
Good explanation, solved my doubts regarding pmf, pdf and cdf.. thank you 😊, have a great day 👍😊
Not sure if you read comments on old videos. looking for advice please. I know nothing about maths or excel until a year or so ago (I am 70 now). I have been using Poisson to predict an event. Imagine a coin. Head, Tails and it can land on its edge. But each time the weight of the coin is heavier on the head side, or tail side or even the edge. Those variables are always known. What is the best type of probability distribution I should be using to predict head,tail or edge. I have watched your video series and now just think that Poisson is not the best fit. Any help would be appreciated. Thank you
What a GREAT intuitive explanation of distribution functions! I can tell your videos will come in useful throughout my Probability course! (and statistics course once that comes along) :)
Very clear explanation thanks. Just curious, how does one determine the height minimum of 140 and maximum of 190? Using known records for short and tall? Also, I guess we are assuming that women's height distribution is about normal? I've always wondered how the population distribution for something like height is determined. Is it determined through sufficient experiments?
Could you do a video about Markov Chains?
I loved the class, thanks ! but I'm sorry, I still didn't get what "probability density of 0.04" means in English?
The explanation is an "Art", You are the "Artist".
No one can explain better than this.
Thanks for saving my time going here and there, did a lot.
Thank you very much.... I have my test tommorow and now I am clear with the concepts.... This presentation was much more clear than my lecture attend clg ... Keep dng such videos on statistics... It helps us students a lot.. thankyou again ❤❤
thank you so much for this
Perfect explanation.... but would be cherry on the cake if u add in some applications and examples n how to use the y-axis values in PDF and CDF in real-time Data related applications
Thank you!
You usually don't use the y-axis value of a PDF directly, in an application. You'd be asking the question of what is the probability that the random variable is exactly 1, for instance. It's a meaningless question for a continuous random variable, because the probability of the variable being exactly any given number is infinitesimal. You need to multiply (or rather integrate) the PDF across a finite interval of the random variable, for the PDF to have a meaning of probability being within that interval. It is the integral of a PDF (i.e. the CDF) that has a meaningful concept.
One application where you may use the PDF's y-axis value directly, is when finding the overlapping area between two probability distributions. You find the point where the two PDF's intersect, and use that as the upper bound of integration when evaluating one CDF, and the lower bound of integration when evaluating the other CDF.
(5:44) I bet Prof. Z's "sternly worded review" was still generous and supportive of the dice-rolling app.
well explained..thank you..have a small request could you also explain how can connect these to industry applications
I'm so glad I found these videos! I am tasked with implementing some of these techniques in code. Deer in front of headlight situation without much of a mathematics background... Not anymore!!
Can you please make a series on optimizing convex problems, lagrangian dual/primal problems, etc....
Why we use term" "mass" for discrete function and "density" for continues function....what is the logic behind this????
Really helpful! appreciate for distinguishing those buzzing term with clear graph
I have subscribed! There is coherence, clarity and fluency. Everything in this video works together for the betterment of your resource. Thank you!
I suggest for a video giving real-life examples and situations that will further explain the topic. By the way, I love your introduction stating that it is more intuitive.
thank god you were there! I was almost halfway through my portions suddenly in book they used PDF achronym dk what they were refering. First few min through your vid my doubt got cleared. thankyou
Beautiful explanation, I was really confused with this.. not anymore!
excellent presentation and explanation!!!👍👍👍👌👌gotta subscribe😀😀
sir please make a video principal components analysis(PCA,FA,DA,CA) etc..
Thank you! this was so helpful. I have subscribed and will recommend this channel to my peers.
you are amazzzzzzzzzzzzzzzzzzzzzzzing teacher. God bless you!!!!!!! I pray to god, you live a long long life more than 200 years of life, so that you can make future generation students life easier.
awesome...very nicely explained. I request you to upload videos on bagging and boosting
I hope your review moved the app devs to make some changes. Absolutely frivolous to snob 3 and 4 like that!