Data Visualization Best Practices | 5 Mistakes to Avoid in Bar Charts | sqlbelle

HTML-код
- Опубликовано: 2 авг 2024
- Data Visualization Best Practices - 5 Mistakes to Avoid in Bar Charts
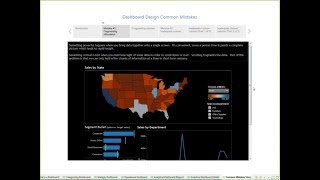
What can make bar charts ineffective or confusing? In this visualization best practices series, we explore five (5) design decisions you should avoid doing when creating bar charts.
I use Tableau to walk through the examples, but these are considerations for bar charts regardless of your tool.
Question:
What are your bar chart pet peeves? Can you relate to the examples in this video? I'd love to know! Please share in the comments :)
#dataviz #datavisualization #data #bestpractice #sqlbelle  Наука
Наука


Looks good. Nicely explained.
Thank you Dennis :)
......Bravo!👍
Your explanations are simple & intelligible!👍
Thank you Mustapha!
In reference to your last example, a dot plot would be be an acceptable solution if the data is going to be plotted without using a zero based axis.
Thank you Jonathon! Yes a dot plot would be a good alternative, thank you for your feedback.
Wonderful, thank you 🌻🦋🌷
Thank you Alicia!
wow again learned many new things thank you thank you for the vidoe
Thank you Peter! 🙂
❤
Amazingly explained
Thank you Kapil!
Very useful
Make more videos please
Thank you Reshma!