What Is Curve Fitting? Fitting Models to Data Made Easy with MATLAB
HTML-код
- Опубликовано: 24 авг 2024
- Curve fitting is a technique used to fit mathematical models to your data, helping you understand the relationship between different factors within your data set. Learn how to apply various curve fitting techniques using MATLAB® to wind turbine analysis with the aim of understanding how various factors influence power output.
With MATLAB, you can:
- Interactively fit curves and surfaces to your data using the Curve Fitter app: bit.ly/3xFxIVe
- Explore higher dimensional models through linear and nonlinear regression methods from Statistics and Machine Learning Toolbox™: bit.ly/441Cok0
- Optimize fitted models by specifying bounds and constraints with the functionality from Optimization Toolbox™: bit.ly/3Jh6s1w
- Incorporate your curve fits from the Curve Fitter app as a lookup table for use in Simulink®: bit.ly/3TX90XJ
Related videos:
- Curve Fitting Toolbox Product Overview: • What Is Curve Fitting ...
- Low-Code Data Analysis with MATLAB: bit.ly/3vYWgI0
- How to Fit a Linear Regression Model in MATLAB: • How to Fit a Linear Re...
Chapters:
00:23 - What is Curve Fitting?
01:32 - Overview of different fitting techniques covered in this video
02:03 - Example: Wind turbine analysis
02:55 - Curve Fitting using the Curve Fitter App
04:21 - Non-linear regression model to capture effects of various factors
05:18 - Optimizing fitted model coefficients
07:06 - Incorporating curve fit into Simulink
08:05 - Conclusion
--------------------------------------------------------------------------------------------------------
Get a free product trial: goo.gl/ZHFb5u
Learn more about MATLAB: goo.gl/8QV7ZZ
Learn more about Simulink: goo.gl/nqnbLe
See what's new in MATLAB and Simulink: goo.gl/pgGtod
© 2024 The MathWorks, Inc. MATLAB and Simulink are registered trademarks of The MathWorks, Inc.
See www.mathworks.com/trademarks for a list of additional trademarks. Other product or brand names may be trademarks or registered trademarks of their respective holders.
my favorite is rational function fitting . i was amazed the first time is tried them
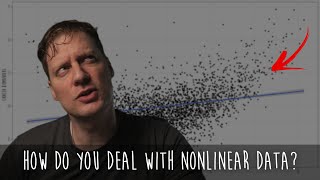
Which app was used for the non linear regression task?
Are you talking about the Curve Fitting App? www.mathworks.com/help/curvefit/curvefitter-app.html?s_eid=PSM_15028
Great question! We created the non-linear regression model using the Statistics & Machine Learning Toolbox. The visualization of the individual factors was done using the "plotSlice" method in that Toolbox.