Thank you very much for the video. I have a question regarding the ability scale/x-axis in the plots. It is always ranging from -4 to 4. Is there a possibility to change resp. rescale it, e.g., to -3 to 3? So that all values (also the extrimity parameters and the discrimination parameters) correspond to the new scale (-3 to 3).
Hmm. I haven't tried adjusting the horizontal/x scale for this specfic plot. But generally adding xlim argument in the plot() function could work. E.g., plot(mod2, xlim=c(-3,3)). Hopefully that will work.
You may need to change the gender field to a different data type. Is the gender field in your dataset a character? If so try converting it to a factor or numeric.
Thanks for the video. I am trying to find information on how to test for both uniform and non-uniform DIF. I was having a hard time understanding in this video if you went through that. Or was the last image you showed with the initial levels of theta the nonuniform? I would like to suggest that a good video would be to distinguish between those two clearly for viewers and also all the plots, on exactly how we interpret them. If you find time of course :-) Thanks again.
Hello Leon, thanks for your interest and suggestion. It is appreciated. I briefly touch on uniform and nonuniform DIF starting at 21:16 of the video. The column comparing models 1 & 2 looks for uniform DIF only, the column comparing difference between models 1 & 3 looks for both uniform and non-uniform DIF, and the column comparing models 2&3 looks for non-uniform DIF only. However, I did not go over them much again when I go over the plots. What I should have also gone over in the plots starting at 23:55 (the 4 plot output for items), is that you can also observe uniform and nonuniform DIF in the ICC plot on the top left. The solid and broken lines (each representing a different group) will have a tiny gap between them (suggesting DIF). If the lines cross at any point they are likely nonuniform. If one line remains mostly above or below the other line, DIF may likely be uniform.
Hello , very nice video with explainations. Im so glad we have a source like that out in the internet. I was gonna ask one thing: In my model when i run the code it only has 2 extremity and 1 discrimination parameter ? I cannot see ext3 and 4 what could be the possible reason for it ?Maybe because of my sample size or response categories ? (my sample have 250 reponses and 3 options for each 22 item)
Thank you for the compliment. For your question you indicated that you have only 3 options; therefore, you will only see 2 extremity parameters. The number of extremity parameters will be k (the # of options or levels in the item scale) - 1. lets say you have k=3 options with option values of 1, 2, and 3. Extremity parameter 1 shows you the latent ability score needed by someone to have a 50% chance of selecting option 1. Extremity parameter 2 shows you the latent ability score needed by someone to have a 50% chance of selecting option 1 or option 2. So, because it is 50/50, extremity parameter 2 is comparing the selection of options 1 or option 2 versus the selection option 3. Consequently, extremity parameter 1 is comparing the selection of option 1 versus the selection of option 2 or option 3.
@@statsguidetree Thank you very much!! That was really informative. I was also wondering what might be the causes of Item Characteristics Plot to be almost flatlined for many items ? It means that these items cannot test the desired measures? But on the opposite side when we constrained discriminity parameter to a fixed value it show extreme rainbow figure ? What might be the causes for that ?
@@onurarnozturk156 There may be a few reasons. The unstained model assumes that the beta parameter is the same across items. You may want to use the anova() function to compare both models and use that to see the preferred model. If the the item response characteristic curve appears very flat in the constrained model than the unstrained model that may suggest that beta parameter is highly variable and should not be constrained. Let's say each item in your instrument has 3 levels (response level=1 indicates less of the construct possessed by the examinee and a response level=3 indicates more of the construct possessed by the examinee). The item response characteristic curve should show response 1 to be higher for low theta, response 2 should be normally distributed around 0 theta, and response 3 should be higher for high theta. Hope that helps.
This has helped me greatly, but I then realized I have to assume a unidimensional model. Will you consider a tutorial for multidimensional IRT with polytomous data, with the mirt package perhaps? That would be a good supplement to this. Of course, with uniform and nonuniform DIF. Thanks for considering! The DIFtree package could also be an awesome video. There isn't a lot of good IRT material out there. I will tip you :-D
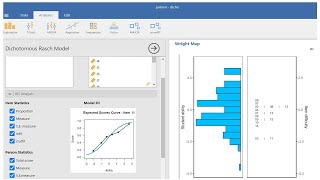
Thank you for an excellent tutorial. It would be very helpful to create a Wright Map to compare the distribution of respondents and item difficulty. Is this possible?
Yes a wright map would work for polytomous scales. It would essentially visualize the parameters for the items and participants that were estimated by the model.
Many thanks for the very instructive video. I am following your lectures. At the end the plot(genDIF, labels, etc etc) seems to automatically plot in a new device, opens new window, however only the 'last' plot is available, as it seems to overwrite all previous ones. I am using Windows 10 and R Studio. Having had a look at stackoverflow I don't seem to be able to find the answer. It is suggested that the plot function is intended to plot automatically in a new device, but this is not clear. Unfortunately, unless fixed this renders the whole plotting useless. Any ideas/suggestions?
Thank you for a very informative video. I was using your tutorial to do a DIF analysis on my own data and have encountered a few errors: 1. in the first try I've got a message saying that there are items that have negative slope parameters (Error in probgrm(theta, DISC[i], CB[i, ]) : slope is missing or negative). I have checked the item parameter table and I have found no negative Dscrmnt values. 2. I have tried running the analysis on a subscale (consisting of third of the original scale items), which ended up with a warning message saying that all items got flagged for DIF. Do you maybe have any general suggestions for these erros? I appreciate any effort invested in answering. Ana
Hello Ana, I assume you are using a polytomous scale. The errors could be a result of a number of things. It is good that you checked for negative Dscrmnt values. In addition, you may want to test some more basic psychometric properties of your scale. You may want to do a unidimensionality check. I show one way in of the IRT videos but another quick way is to look at a scree plot. First get a correlation matrix for your data: cor_mat
A couple of more things. The function lordif also gives you the option to change your criterion for detecting DIF to effect size calculated by R-squared criterion ='R2' or effect size estimated by beta change criterion ='Beta'. Even if you leave criterion=’Chisq’ you will also get output for R-squared values and the beta change value when you use the plot function. If you want to be very conservative, you can discuss that you would only be interested in removing DIF if they were significant and had an R-squared value of at least .13. “Zumbo (1999) suggested several pseudo R-squared statistics as magnitude measures and guidelines for classifying DIF as negligible (< 0.13), moderate (between 0.13 and 0.26), and large (> 0.26)”. -from Choi, Gibbons, and Crane (2011). Therefore you can choose to ignore significant DIF if the effect size is not high enough.
@@statsguidetree thank you for your kind response. I am using a dataset consisting of responses on a validated questionnaire with good reliability (0.90 and higher) and no reverse coded items. The items are polytomous (1-5 likert scale) and there are 3 subscales. Previous research showed that there are 3 factors and 1 higher-order factor. I have tried running the PCA as you have suggested and the component at which the cumulative variance row reached .51 was 10th. The eigenvalues over 1 criterium showed the same, but scree plot (done in SPSS as I am more used to that software) indicated that 3 (or maybe 4) components should be kept. So, I guess multidimensional or bifactor model should be more appropriate and this could be the reason my analysis failed? Is it possible to do the ordinal logistic reggression with MGRM or bifactor model? Or can I somehow force the unidimensional model to my data?
@@anacosicpilepic3864 Thank you for providing the information. Since the scale you are working with is multidimensional you would have to apply a multidimensional extension of DIF. Now the DIF procedures are mainly meant to detect differences between groups. It does not tell us why responses to a set item differ, only the they do. There has been some research suggesting that these differentially functioning items are likely due to some discrepancy on a second factor that may exist in a test. The reason for this is that some degree of multidimensionality is expected with many tests. However for the scale you are using because there is already research suggesting that it is multidimensional you may need to account for this. Though I wouldn't expect it to fail based on the presence of multidimensionality, since the overall reliability was high. I assume you are using alpha on the entire scale. This would mean their is high inter-item correlation in your scale.
@@anacosicpilepic3864 An alternative method you can try is the simultaneous item bias test (SIBTEST) in r. Below is the rcode using the dataset names in the video. Where gcbs[,1:15] is the items 1-15 in the dataset gcbs, gcbs[,16] is the field containing my grouping variable gender, and focal.name=1 is the value referring to the gender group in the field gcbs[,16] that I am setting as the focal group. install.packages("difR") library(difR) dif1
Thank you so much for these lectures! I am a new learner for R. When it comes to DIF, I am getting the following result again and again: "nrow of resp.data and length of group are non-conformable" . I have eight items, and the ninth variable is the gender, used the this code: genposDIF
this is such a terrific video. thanks. I wish that you would have more similar pieces. I have 2 questions: a) I am trying to examine DIF between 4 latent classes. Can the command: sex_a


Here is the rcode:
# Generic Conspiracist Beliefs Scale (GCBS; Brotherton, French,
# and Pickering, 2013) response dataset.
# Source: openpsychometrics.org/_rawdata/
# Load dataset downloaded 15 items with scale containing 5 levels
# (1=S.Disagree,2=Disagree, 3=Neutral, 4=Agree, and 5=S.Agree)
gcbs
I am having trouble getting lordif to work. Is it dependent on an older version or R?
Thank you for the great video.
You can use MCMC estimation for gem function? Not EM algorithm.
Thank you very much for the video. I have a question regarding the ability scale/x-axis in the plots. It is always ranging from -4 to 4. Is there a possibility to change resp. rescale it, e.g., to -3 to 3? So that all values (also the extrimity parameters and the discrimination parameters) correspond to the new scale (-3 to 3).
Hmm. I haven't tried adjusting the horizontal/x scale for this specfic plot. But generally adding xlim argument in the plot() function could work. E.g., plot(mod2, xlim=c(-3,3)). Hopefully that will work.
genDIF
You may need to change the gender field to a different data type. Is the gender field in your dataset a character? If so try converting it to a factor or numeric.
Thanks for the video. I am trying to find information on how to test for both uniform and non-uniform DIF. I was having a hard time understanding in this video if you went through that. Or was the last image you showed with the initial levels of theta the nonuniform? I would like to suggest that a good video would be to distinguish between those two clearly for viewers and also all the plots, on exactly how we interpret them. If you find time of course :-) Thanks again.
Hello Leon, thanks for your interest and suggestion. It is appreciated. I briefly touch on uniform and nonuniform DIF starting at 21:16 of the video. The column comparing models 1 & 2 looks for uniform DIF only, the column comparing difference between models 1 & 3 looks for both uniform and non-uniform DIF, and the column comparing models 2&3 looks for non-uniform DIF only. However, I did not go over them much again when I go over the plots. What I should have also gone over in the plots starting at 23:55 (the 4 plot output for items), is that you can also observe uniform and nonuniform DIF in the ICC plot on the top left. The solid and broken lines (each representing a different group) will have a tiny gap between them (suggesting DIF). If the lines cross at any point they are likely nonuniform. If one line remains mostly above or below the other line, DIF may likely be uniform.
@@statsguidetree Thanks for the response!
Hello , very nice video with explainations. Im so glad we have a source like that out in the internet. I was gonna ask one thing: In my model when i run the code it only has 2 extremity and 1 discrimination parameter ? I cannot see ext3 and 4 what could be the possible reason for it ?Maybe because of my sample size or response categories ? (my sample have 250 reponses and 3 options for each 22 item)
Thank you for the compliment. For your question you indicated that you have only 3 options; therefore, you will only see 2 extremity parameters. The number of extremity parameters will be k (the # of options or levels in the item scale) - 1. lets say you have k=3 options with option values of 1, 2, and 3. Extremity parameter 1 shows you the latent ability score needed by someone to have a 50% chance of selecting option 1. Extremity parameter 2 shows you the latent ability score needed by someone to have a 50% chance of selecting option 1 or option 2. So, because it is 50/50, extremity parameter 2 is comparing the selection of options 1 or option 2 versus the selection option 3. Consequently, extremity parameter 1 is comparing the selection of option 1 versus the selection of option 2 or option 3.
@@statsguidetree Thank you very much!! That was really informative. I was also wondering what might be the causes of Item Characteristics Plot to be almost flatlined for many items ? It means that these items cannot test the desired measures? But on the opposite side when we constrained discriminity parameter to a fixed value it show extreme rainbow figure ? What might be the causes for that ?
@@onurarnozturk156 There may be a few reasons. The unstained model assumes that the beta parameter is the same across items. You may want to use the anova() function to compare both models and use that to see the preferred model. If the the item response characteristic curve appears very flat in the constrained model than the unstrained model that may suggest that beta parameter is highly variable and should not be constrained. Let's say each item in your instrument has 3 levels (response level=1 indicates less of the construct possessed by the examinee and a response level=3 indicates more of the construct possessed by the examinee). The item response characteristic curve should show response 1 to be higher for low theta, response 2 should be normally distributed around 0 theta, and response 3 should be higher for high theta. Hope that helps.
This has helped me greatly, but I then realized I have to assume a unidimensional model. Will you consider a tutorial for multidimensional IRT with polytomous data, with the mirt package perhaps? That would be a good supplement to this. Of course, with uniform and nonuniform DIF. Thanks for considering!
The DIFtree package could also be an awesome video. There isn't a lot of good IRT material out there. I will tip you :-D
Thank you so much for the kind words. I will definitely try and post a follow up going over DIF with multidimensional tests in the very near future.
Thank you for an excellent tutorial. It would be very helpful to create a Wright Map to compare the distribution of respondents and item difficulty. Is this possible?
Yes a wright map would work for polytomous scales. It would essentially visualize the parameters for the items and participants that were estimated by the model.
@@statsguidetree it would be tremendous is you could give/demonstrate the R code to compare males/females in your example. Thanks again.
Many thanks for the very instructive video. I am following your lectures. At the end the plot(genDIF, labels, etc etc) seems to automatically plot in a new device, opens new window, however only the 'last' plot is available, as it seems to overwrite all previous ones. I am using Windows 10 and R Studio. Having had a look at stackoverflow I don't seem to be able to find the answer. It is suggested that the plot function is intended to plot automatically in a new device, but this is not clear. Unfortunately, unless fixed this renders the whole plotting useless. Any ideas/suggestions?
I just ran into the same issue and haven't found a fix. Have you had any luck with this?
Thank you for a very informative video. I was using your tutorial to do a DIF analysis on my own data and have encountered a few errors:
1. in the first try I've got a message saying that there are items that have negative slope parameters (Error in probgrm(theta, DISC[i], CB[i, ]) : slope is missing or negative). I have checked the item parameter table and I have found no negative Dscrmnt values.
2. I have tried running the analysis on a subscale (consisting of third of the original scale items), which ended up with a warning message saying that all items got flagged for DIF.
Do you maybe have any general suggestions for these erros? I appreciate any effort invested in answering.
Ana
Hello Ana, I assume you are using a polytomous scale. The errors could be a result of a number of things. It is good that you checked for negative Dscrmnt values. In addition, you may want to test some more basic psychometric properties of your scale. You may want to do a unidimensionality check. I show one way in of the IRT videos but another quick way is to look at a scree plot. First get a correlation matrix for your data:
cor_mat
A couple of more things. The function lordif also gives you the option to change your criterion for detecting DIF to effect size calculated by R-squared criterion ='R2' or effect size estimated by beta change criterion ='Beta'. Even if you leave criterion=’Chisq’ you will also get output for R-squared values and the beta change value when you use the plot function. If you want to be very conservative, you can discuss that you would only be interested in removing DIF if they were significant and had an R-squared value of at least .13.
“Zumbo (1999) suggested several pseudo R-squared statistics as magnitude measures and guidelines for classifying DIF as negligible (< 0.13), moderate (between 0.13 and 0.26), and large (> 0.26)”. -from Choi, Gibbons, and Crane (2011). Therefore you can choose to ignore significant DIF if the effect size is not high enough.
@@statsguidetree thank you for your kind response. I am using a dataset consisting of responses on a validated questionnaire with good reliability (0.90 and higher) and no reverse coded items. The items are polytomous (1-5 likert scale) and there are 3 subscales. Previous research showed that there are 3 factors and 1 higher-order factor. I have tried running the PCA as you have suggested and the component at which the cumulative variance row reached .51 was 10th. The eigenvalues over 1 criterium showed the same, but scree plot (done in SPSS as I am more used to that software) indicated that 3 (or maybe 4) components should be kept. So, I guess multidimensional or bifactor model should be more appropriate and this could be the reason my analysis failed? Is it possible to do the ordinal logistic reggression with MGRM or bifactor model? Or can I somehow force the unidimensional model to my data?
@@anacosicpilepic3864 Thank you for providing the information. Since the scale you are working with is multidimensional you would have to apply a multidimensional extension of DIF. Now the DIF procedures are mainly meant to detect differences between groups. It does not tell us why responses to a set item differ, only the they do. There has been some research suggesting that these differentially functioning items are likely due to some discrepancy on a second factor that may exist in a test. The reason for this is that some degree of multidimensionality is expected with many tests. However for the scale you are using because there is already research suggesting that it is multidimensional you may need to account for this. Though I wouldn't expect it to fail based on the presence of multidimensionality, since the overall reliability was high. I assume you are using alpha on the entire scale. This would mean their is high inter-item correlation in your scale.
@@anacosicpilepic3864 An alternative method you can try is the simultaneous item bias test (SIBTEST) in r. Below is the rcode using the dataset names in the video. Where gcbs[,1:15] is the items 1-15 in the dataset gcbs, gcbs[,16] is the field containing my grouping variable gender, and focal.name=1 is the value referring to the gender group in the field gcbs[,16] that I am setting as the focal group.
install.packages("difR")
library(difR)
dif1
Thank you so much for these lectures! I am a new learner for R. When it comes to DIF, I am getting the following result again and again: "nrow of resp.data and length of group are non-conformable" . I have eight items, and the ninth variable is the gender, used the this code: genposDIF
Thanks for the kind words. About the error you are getting. Try setting your data as a data frame. Run the following code first positivemindset
@@statsguidetree Thanks so much for your video as well. Just like Nargiza Chorieva, I have the same error. When I ran the code > PSS20_ForR
@@chingsinsiau477 For this one I think the issue is that the function should be written as as.data.frame() and not as.dataframe()
this is such a terrific video. thanks. I wish that you would have more similar pieces.
I have 2 questions: a) I am trying to examine DIF between 4 latent classes. Can the command: sex_a