If you highlight the section of code you want to run and press control + enter it should appear to show the progress of running your code. If there are errors it would become red. Good question!
Hi thanks for the video, greatly helped. I was just wondering if it would be possible to add the Tukey's test as well in the code using the stat_compare_means?
Hello! You should be able to add it into stat_compare_means. It might be that you add it in as a t.test rather than an ANOVA. It would look something like this: stat_compare_means(method="t.test"). I hope this helps. If not here is a link to break down the components of adding comparisons in ggplot: rpkgs.datanovia.com/ggpubr/reference/stat_compare_means.html
@@rajendraregmi2892 Great question. You would need to run ggplot through a series of pipes "%>%" leading with your data frame, in this case DN_Master_Data %>% (insert the ggplot script to create your boxplot). Then after you create your plot you can do a summary function of "anova" as such anova(lm(pH ~ Treatment, DN_Master_Data)). This creates a linear model and you can further detail interactions within this function. To avoid being too long winded, here's a link to a detailed explanation of how you can achieve this! I hope this helps: publish.illinois.edu/liangf/teaching/stat-424/rcode-two-way-anova/
This could be anything from network connection to needing another package installed. Without seeing the code I cannot fully assess what the issue might be. If you copy and paste the error into google that may help.
Sorry for not seeing this until now! A box and whisker plot (which is what is shown in the video) shows the full range of the data. The box itself represents the interquartile range of the data. What I mean by this is that the lower end of the box is the 25th percentile, the middle line is the 50th percentile (better known as the mean), and the upper end of the box is the 75th percentile. Additionally, the whiskers (the lines extending above and below the box) represent the sample error of the data and can expose outliers in your data as well. This is why some of the whiskers are longer than others. This is because it depends on the treatment.
Hello! You want to make sure you use stat_compare not start_compare. Minor difference in syntax, but will be the difference for the script working versus not in this instance. Hope this helps!

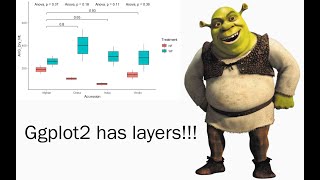

![Boxplots in R with ggplot and geom_boxplot() [R- Graph Gallery Tutorial]](http://i.ytimg.com/vi/Ww5kQuHtqKQ/mqdefault.jpg)


I appreciate your teaching method and it is very interesting.
Thank you! I appreciate hearing that!
ahh man you explained this so nicely!
Thanks for the excellent video. How do you activate that green line that appears when you run the code eg at 5:05?
If you highlight the section of code you want to run and press control + enter it should appear to show the progress of running your code. If there are errors it would become red. Good question!
Hi thanks for the video, greatly helped. I was just wondering if it would be possible to add the Tukey's test as well in the code using the stat_compare_means?
Hello! You should be able to add it into stat_compare_means. It might be that you add it in as a t.test rather than an ANOVA. It would look something like this: stat_compare_means(method="t.test").
I hope this helps. If not here is a link to break down the components of adding comparisons in ggplot:
rpkgs.datanovia.com/ggpubr/reference/stat_compare_means.html
Very nice video, how can I do for two factors anova?
@@rajendraregmi2892 Great question. You would need to run ggplot through a series of pipes "%>%" leading with your data frame, in this case DN_Master_Data %>% (insert the ggplot script to create your boxplot). Then after you create your plot you can do a summary function of "anova" as such anova(lm(pH ~ Treatment, DN_Master_Data)). This creates a linear model and you can further detail interactions within this function. To avoid being too long winded, here's a link to a detailed explanation of how you can achieve this! I hope this helps: publish.illinois.edu/liangf/teaching/stat-424/rcode-two-way-anova/
@@ecomattp Thank you. I will go through this link and let you know if I need more help. Thanks
Hi, i keep getting an "R code execution error" every time i type in the stat_compare_means command. I have installed the package
This could be anything from network connection to needing another package installed. Without seeing the code I cannot fully assess what the issue might be. If you copy and paste the error into google that may help.
can you pls explain to me what each thing mean in the plot? Is the line showing the mean or the median ?
for example
Sorry for not seeing this until now! A box and whisker plot (which is what is shown in the video) shows the full range of the data. The box itself represents the interquartile range of the data. What I mean by this is that the lower end of the box is the 25th percentile, the middle line is the 50th percentile (better known as the mean), and the upper end of the box is the 75th percentile.
Additionally, the whiskers (the lines extending above and below the box) represent the sample error of the data and can expose outliers in your data as well. This is why some of the whiskers are longer than others. This is because it depends on the treatment.
i tried using the Start_comapre function, but it doesn't work (I installed and library the ggpubr package), can you pls help?
Hello! You want to make sure you use stat_compare not start_compare. Minor difference in syntax, but will be the difference for the script working versus not in this instance. Hope this helps!
@@ecomattp thank you!!