How to Make Time Series Climate Data in R |

HTML-код
- Опубликовано: 9 сен 2024
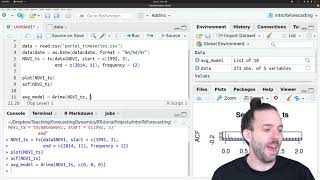
- How to Plot time series data in R ☑️
Time Series Analysis | Time Series Forecasting | Time Series Analysis in R
Please Subscribe My Channel :
/ @resneed1
#timeseriesanalysis
#climatechange
#plotclimatetrend


Thank you very much. The tutorial is highly beneficial
Glad it helped
Thank you
Very nice!!! Thank you!
if i want to add Q and Z value ,what is the code for that?
This is absurd without an audio from you that explain the video but rather with a background music that can even hinder comprehension
@@olusegundavid-wi2kh writing a code does not need to speak , you just need to fallow the coding. It is not for beginners, it is for certsin scientific question for researchers. All the best
Ok
Please please create a video demonstrating the use of the Bartlett-Lewis rectan-gular pulses of the seven tool
parameters (BLRP) model (BLRPM) on the data.. For example, if I have daily rain data and I want to separate it and reduce it to hours using this function.. Please create a video explaining this.
Ok. I will do it soon.
@@ResNeeD1 l hope you will create the video within this week because iam a graduate student and my research is based on this method because I am having difficulty applying it and I am dire need of it. I hope to create a vedio this week. 🙏🙏
@@ResNeeD1 and remember me if you upload the video
Thank you very much. Note that the version of my program R studio 4.3.1
Hello brother, I would like you to create a video @@ResNeeD1
How to take exact values of the blue line? For example how to extract 2000 point value of lm line?
which value do you mean? the blue line is trend line. can you tell me what do you want to excatly?
I want to take blue line's value at one year and another to get difference. With that difference I can predict future values. Is it possible to extract value from blue line at the exact time? Also this is linear trend line, can I make x^2 line, cause my data distribution at least seems to be x^2