Quantopian Lecture Series: Kalman Filters

HTML-код
- Опубликовано: 18 июн 2024
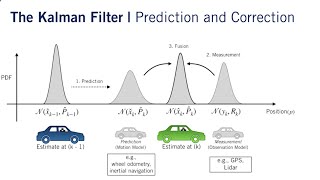
- Kalman Filters are used in signal processing to estimate the underlying state of a process. They are incredibly useful for finance, as we are constantly taking noisy estimates of key quantities and trading indicators. This notebook introduces Kalman Filters and shows some examples of application to quantitative finance. You can view the corresponding notebooks from this lecture here: bit.ly/clonekalmanfilter.
To learn more about Quantopian, visit us at: www.quantopian.com.
Disclaimer
Quantopian provides this presentation to help people write trading algorithms - it is not intended to provide investment advice.
More specifically, the material is provided for informational purposes only and does not constitute an offer to sell, a solicitation to buy, or a recommendation or endorsement for any security or strategy, nor does it constitute an offer to provide investment advisory or other services by Quantopian.
In addition, the content neither constitutes investment advice nor offers any opinion with respect to the suitability of any security or any specific investment. Quantopian makes no guarantees as to accuracy or completeness of the views expressed in the website. The views are subject to change, and may have become unreliable for various reasons, including changes in market conditions or economic circumstances.  Наука
Наука


Nice intuitive intro to Kalman filters
Good explanation
Also, in the example given around 5:30, how far back does the Kalman filter measure data points to create its estimation?
the first 20 data points of the spread
Hi , the links of the notebooks are not working now , could you please have a look into it
+1 would be greatly appreciated
I had to deal with this filter, figured it out and now can say that the video is a lil bit misleading. Kalman filter does require user provided inputs that may completely change the result: observation covariance and transition covariance. Idk why they used 1 and 0.01 in the video, but try changing these values and you'll see. Commenting just to save your time.
4:45 Where is defined the function *get_pricing()*
I tried to run the notebook and got an error
import pandas_datareader.data as web
x = web.DataReader ('lmt', 'yahoo', '2013-01-01', '2015-01-01')
And after that, use "x.Close" instead of just "x".
I had to deal with this filter, figured it out and now can say that the video is a lil bit misleading. Kalman filter does require user provided inputs that may completely change the result: observation covariance and transition covariance. Idk why they used 1 and 0.01 in the video, but try changing these values and you'll see. Commenting just to save your time.
Thank you so much for the nice video. Would you pls tell us what software is used here to generate the results and graphs?
It is some sort of custom jupyter notebook instance and to generate the graphs he propably used the python module matplotlib I guess
@@ralf7131 The Kalman filter is implemented in the Python library pykalman.
nice