NextGEMS Cycle 3 simulation at 5 km resolution with ICON R2B9: ocean velocity at 75m depth

HTML-код
- Опубликовано: 19 сен 2023
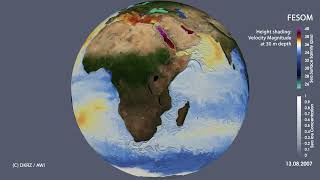
- Visualization of the velocity magnitude at 75 m depth of a simulation with a coupled global setup of ICON/ICON-O at a horizontal resolution of ~5 km. The simulation was carried out on DKRZ's supercomputer Levante.
The visualization covers mIn contrast to the respective visualization of the current magnitude at the ocean's surface, the flow field at 75 m depth is much less dominated by weather pattern. However, the influences of strong storms such as hurricanes are even depictable at this depth .
Simulation: MPI-M / DKRZ
Visualization: Michael Böttinger, DKRZ
Information on NextGEMS: nextgems-h2020.eu/  Наука
Наука


Can you explain what I'm watching but like you would to a 5 yr old?
When you look at the ocean surface from above (in a cloud free region), you would mainly see a dark blue surface and some texture due to ocean waves. The state of the ocean, i.e. temperature, salinity, ocean velocity remains invisible - it can only be measured.
Here you see a visualization the velocity of the ocean currents at a depth of 75 m, a part of the ocean, which we even can't see from satellites. High ocean velocity is shaded in dark blue, while water streaming very slowly is rendered as a white surface. Furthermore, the ocean surface is locally lifted up a bit ("height mapping") according to the flow speed, resulting in a 3d suface, that allows to depict different flow patterns, although the differences in velocity magnitude are rather small. The strong boundary currents such as the Gulf Stream are clearly visible, but also less prominent flow systems can be studied.
Does this help?