crystal clear, thanks! great job, though I will have to re-watch the last 3mins... too many "logs" at some point, can be a bit of overkill being confronted with multiple logs / e to power of... within a sentence ... for ppl that are not so familiar with logs. not that I'm completely unfamiliar with it, but it s not as crystal clear as "mean" etc. in my head, always takes a bit to process it
best tutorial on poi regression ever. I wished you explained also the poi regression with multiple explenatory variables. That would have been awesome. Thank you so much this helped me wiht my statistics assignment!
Thank you! Maybe my video on multiple linear regression might help you to interpret a model with 2 explanatory variables. ruclips.net/video/AP_K7SaKkIE/видео.html
Why assume a normal distribution in the error terms of the exponential model and not an exponential distribution which still doesn't allow negative values and the variance is a function of the mean like in poisson?
Because exp dist models a continuous variable, which may take negative values. For example, if you measure the concentration of a drug, which decays exponentially, the concentration will approach zero. When the concentration is close to zero, the instrument that you measure with may result in negative values. However, you can use another distribution for the error term if that fits your data better.
@@tilestats in the example presented in your video if we assume an exponential distribution in the error terms then could we model this way instead of a poisson regression?
Very good. But why are you making things more complicated than they are? At about 13 minutes in you talk about "multiplicative factor" and use it to predict the counts. Why not just plug in the value of x into the original formula (e^(4.605 - .418 x)). This will get you the number of counts for a given week x. Musch more straight forward, much more intuitive, and more direct. Maybe I'm missing why you did it the other way. It kind of threw me off doing it your way. But thanks for the video
To calculate the predicted counts you should, as you say, of course, use the equation but the whole idea was to explain how to interpret the coefficients in Poisson regression, not explain how to calculate the predicted counts.
@@tilestats Thank you. One last ques: I'm a bit uncertain when you say the variance has to be equal to the mean. Does this mean that the mean of all the Y values of the points on the graph at 2:31 must be equal to the variance of those same Y values shown on the graph represented by the dots? in other words do you mean that the mean of all the Y values (all the actual observed counts not predicted counts) on a scatter plot must be equal to the variance of all those Y values? Or is it just the mean of the observed Y values for a certain week ( a certain x value) than must equal the variance of the Y values for that particular week. thanks
great explanation, I have one comment, in the graph in the X axis you wrote week, better to say weeks because you are dealing different weeks, not single week. statistic beginners may confuse it. thank you and keep up your efforts.
how exactly would I calculate the skewed poisson distributed variance that is talked about in 5:00 onwards (for example for calculating non-symmetric confidence limits?
@@tilestats brilliant, thank you. But one thing is unclear to me. For lower bound, α/2 is replaced by .975. However, α/2 is not .975 if α=.05. Should it be 1-(α/2) for lower bound and α/2 for upper bound?


Better and easier explanation than most statistic books. Great job!
This made the concept click in my brain. Best video on the topic out there
Thank you!
finally a good video, i tried so many videos to understand GLMs and Poisson.... thank you!
Best tutorial on poisson reg
Great explanation with simple example, and simple in tutorial means perfect. Thank you!
crystal clear, thanks! great job, though I will have to re-watch the last 3mins... too many "logs" at some point, can be a bit of overkill being confronted with multiple logs / e to power of... within a sentence ... for ppl that are not so familiar with logs. not that I'm completely unfamiliar with it, but it s not as crystal clear as "mean" etc. in my head, always takes a bit to process it
Thank you! Yes, log can be confusing.
best tutorial on poi regression ever. I wished you explained also the poi regression with multiple explenatory variables. That would have been awesome. Thank you so much this helped me wiht my statistics assignment!
Thank you! Maybe my video on multiple linear regression might help you to interpret a model with 2 explanatory variables.
ruclips.net/video/AP_K7SaKkIE/видео.html
Why assume a normal distribution in the error terms of the exponential model and not an exponential distribution which still doesn't allow negative values and the variance is a function of the mean like in poisson?
Because exp dist models a continuous variable, which may take negative values. For example, if you measure the concentration of a drug, which decays exponentially, the concentration will approach zero. When the concentration is close to zero, the instrument that you measure with may result in negative values. However, you can use another distribution for the error term if that fits your data better.
@@tilestats in the example presented in your video if we assume an exponential distribution in the error terms then could we model this way instead of a poisson regression?
Kindly make video on gamma regression, ridge, lasso, elastic net, bayesian regression, orthogonal regression, quantile regression, weighted regression,
I put that on my list. I have a set of basic lectures to do first.
Very good. But why are you making things more complicated than they are? At about 13 minutes in you talk about "multiplicative factor" and use it to predict the counts. Why not just plug in the value of x into the original formula (e^(4.605 - .418 x)). This will get you the number of counts for a given week x. Musch more straight forward, much more intuitive, and more direct. Maybe I'm missing why you did it the other way. It kind of threw me off doing it your way. But thanks for the video
To calculate the predicted counts you should, as you say, of course, use the equation but the whole idea was to explain how to interpret the coefficients in Poisson regression, not explain how to calculate the predicted counts.
@@tilestats Thank you. One last ques: I'm a bit uncertain when you say the variance has to be equal to the mean. Does this mean that the mean of all the Y values of the points on the graph at 2:31 must be equal to the variance of those same Y values shown on the graph represented by the dots? in other words do you mean that the mean of all the Y values (all the actual observed counts not predicted counts) on a scatter plot must be equal to the variance of all those Y values? Or is it just the mean of the observed Y values for a certain week ( a certain x value) than must equal the variance of the Y values for that particular week. thanks
This video hopefully explains it
ruclips.net/video/jnKDQtDy0Bg/видео.html
GREAT!!!!!!! I LOVE YOU
Thank you for the video!
this really clicked with me, thank you! seconding the request for gamma regression
Great!
3rd request for gamma regression
Very clear explanation! Thanks for the illustrations and the great examples!!!
Please write an end to end to end Stats + Machine Learning book! Will definitely buy!
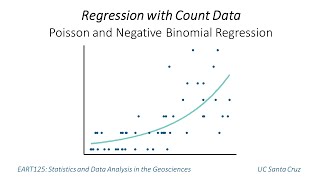
great explanation, I have one comment, in the graph in the X axis you wrote week, better to say weeks because you are dealing different weeks, not single week. statistic beginners may confuse it.
thank you and keep up your efforts.
You are saving my life. I'm implementing one for a bayesian statistics class and got kind of lost at some point. Thanks!
Fantastic explanation. Thank you!
Nice explanation thank you so much!🙂
Thanks! This is helpful
You have saved my phd thesis
You are an awesome teacher!
But why call it poisson regression where the graph you used is clearly follows a exponential distribution?
Because the data points around the fitted curve follow a Poisson distribution.
This lecture is very helpful. I am looking forward to the next.
Great! Yes, there are 6 more videos about Poisson regression on my channel.
You are missing the lambda ^ k term everywhere?
Do you refer to the Poisson distribution
ruclips.net/video/FKZ1cgqh-_Q/видео.html
?
@@tilestats yes I think so. Can't remember for sure.
how exactly would I calculate the skewed poisson distributed variance that is talked about in 5:00 onwards (for example for calculating non-symmetric confidence limits?
I think this page explains it in a simple way:
www.statology.org/poisson-confidence-interval/
@@tilestats brilliant, thank you.
But one thing is unclear to me.
For lower bound, α/2 is replaced by .975. However, α/2 is not .975 if α=.05. Should it be 1-(α/2) for lower bound and α/2 for upper bound?
Yes, it seems to be incorrect. It should be:
upper: 1-(α/2) = 0.975
Lower: (α/2) = 0.025
if α = 0.05
thank you ! how do we evaluate the overall fit of the model ?
That is explained in this video
ruclips.net/video/5GJR81WgLN0/видео.html
interesting! your contact pls.
If you have a question related to the video, you can ask here.