Conducting a Simple Linear Regression in SPSS with Assumption Testing

HTML-код
- Опубликовано: 4 окт 2024
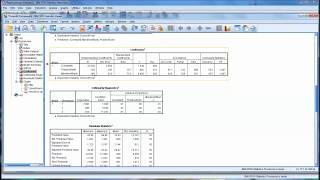
- This video demonstrates how to conduct and interpret a simple linear regression in SPSS including testing for assumptions. A simple linear regression determines the percentage of variance in a dependent variable that is attributable to a single independent variable.


![Eminem - Temporary (feat. Skylar Grey) [Official Music Video]](http://i.ytimg.com/vi/ZaK9Wi5ho0o/mqdefault.jpg)


Thanks so much Dr Grande. I learn so much from you videos that I can't even begin to tell. Your explanation is great, voice is clear and the flow is just the perfect. Bless you for contributing to education.
Your videos are exceptional! They are more, more, more helpful than my textbook! Thank you!!!!
what if the dependent variables not normally distributed, can i still run the next assumptions?
I like that you took your time to explain step by step. It would be easy to follow along and practice linear regressions while watching your video!
This really helps to break down the steps involved and understand the importance of each.
Really good video. I like how you explained everything that is important to a Regression. Thank you
How should we sort our data for example, I want to study data for a country for a 5 year period. How should I input those 5 years data in SPSS?
Excellent demonstration of the logic and operations required to conduct a simple linear regression in SPSS.
Wish I would have found this one before I took the exam! Never the less very helpful for our upcoming assignment!
Thanks for a clear explanation for running a simple linear regression
This video is the only video i understood...Thank You!
You're welcome - thank you for watching.
Helpful for studying for the exam, thanks.
This video was so helpful!
Thank you for your amazing demonstration
but what if we have to conduct a linear relationship test on not-normally distributed variables?
You mentioned the assumption of not having outliers but didn't cover how this is checked. Are you using Cook's D or the Std. Residual numbers to assess for outliers? Also, you looked at the R squared value to assess the significance of prediction. I thought that the p value in the Sig. column of the ANOVA table would tell us the significance of prediction. Is this incorrect?
Can regression and/or correlation be done when one has a large number of DEPENDENT VARIABLES and one Independent Variable (treatment groups) in an experimental study?
Thank you for the video!
Why does the St. Residual and the Stud. Residual have to be between -3 and +3 under the "Residual Statistics" Table?
Standard deviations. Values further out indicate the presence of outliers that will skew the data. This is important because 99% of the values should fall within 3 st. deviations. So, to have data that fall outside of 3, means there is a problem with the linear regression model.
why you want correlation between two variable greater than .3?
Were you able to figure this out? I'm trying to find out myself why this is.
@@WildHeartAngel3 Values between 0.3 and 0.7 (-0.3 and -0.7) indicate a moderate positive (negative) linear relationship via a fuzzy-firm linear rule. Values between 0.7 and 1.0 (-0.7 and -1.0) indicate a strong positive (negative) linear relationship via a firm linear rule.
I have been following your videos on SPSS and they have helped me alot. Can I discuss with you Regression if you could spare some time for that. Thank you.
Helpful - thank you!
Very helpful video
How should we sort our data in Excel, for example, I want to study data for a country for a 5 year period. How should I input those 5 years data in SPSS? Should I upload each year separately into SPSS from Excel?
What do you do if your unstandardised B constant is a negative number?
Thank you for thiss!
How do we report the assumption testing in writing in our essays
For normality testing if I put four variables and two of these came back non statistically significant and the other two didn’t. What does this suggest about my hypothesis
This probably suggests that two of your variables are not normally distributed, which means you have to run a non-parametric alternative to the pearson correlation using Kendalls tau or spearman's rho, if you get a significant result for the correlation, try to run the regression anyways, as long as the other assumptions are met, the violation of normality should not play a very big role.
You show to conduct assumption testing, but you do not explain what the output is for (i.e., what does the standardized residual needing to fall between -3 and 3 indicate? outliers?)
yes, outliers
Thank you
thank you.
very interesting
vo