What is your favorite part of this video? Let us know in the comments. Check out the blog post for details: volkovlabs.io/blog/how-to-create-your-first-grafana-dashboard-bd0f68d631bd/
@@2jyen We explained in the blog post where we got it from: volkovlabs.io/blog/how-to-create-your-first-grafana-dashboard-bd0f68d631bd/#choose-a-dataset
I came across this channel looking for some answers and I find it very interesting! As long as I dive deeper into subject, I begin to find the answers I was seeking. Thanks!
Thanks a lot for this great video! I'd like to ask you please to add the content of how to work with a Business Grafana Dashboard that uses time intelligence, not in time series like, but let's say having a calendar table in order to filter a fact table in which there are orders, with order date and shipping date, and being able to filter in a range of dates and get the total number of orders placed and shipped, or get the cumulative metrics such as YTD or QTD and so on. For many small companies, Grafana could be a great alternative to Power BI. I hope you could publish a Business Grafana Dashboard part 2! Thanks again for the great work!
Thank you for the great idea! We are planning to create Business Grafana dashboard part 2 which will include Calendar, Variable and other panels we developed and maintaining since publishing part 1. We will look into include the proposed topics in the new video.
Good afternoon, thank you very much for those excellent videos, a beautiful work that helps many people interested in these technologies, you could make a video where Apache echarts is used with grapher for 3D graphics. Thank you for existing, many blessings and infinite abundance.
Thank you for the feedback. We have not covered 3D graphics with Apache ECharts yet and will look into it. Please let us know if there is anything else.
When we have config in MySQL or PostgreSQL, we can add data source to a database, prepare a query to choose annotations, and show them in the calendar plugin. This is the second way to have access to annotation on our local Grafana instance. Of course, we ask for data from remote Grafana API is very useful.
Retrieving data from the Grafana or any other database you are not developing may be a short-term solution. For a long-term solution, we recommend using provided API.
We use Timescale container for all our projects and tutorials: volkovlabs.io/blog/grafana-postgresql-20230123/ ``` docker run -d --name timescaledb -p 5432:5432 \ -e POSTGRES_PASSWORD=password \ timescale/timescaledb:latest-pg14 ```
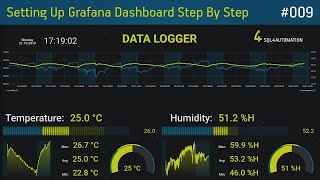
It's a threshold configuration at 9:37. Values over 50 are marked as red. Grafana documentation: grafana.com/docs/grafana/latest/panels-visualizations/configure-thresholds/
Hello ,great video! I just have one problem. I'm using the dummy database from postgreSQL and I am struggling with the filters. I have created them but I don't with what SQL statement you get them to work. I saw you used dollar sign but the statement to put does in I don't understand. Can you help?
If you are referencing to the template and dashboard variables, you can find more information in the Grafana Documentation: grafana.com/docs/grafana/latest/datasources/postgres/#templating
very helpful, grafana is frustrating as I try to find out where I need to make a change to get the visualization to look how I want, for example is the setting in the query, the side panel under visualization, or transformations like you just showed. Config from query results is a helpful transformation.
Thank you . We have many videos like this one in our Crash Course to explain main Grafana concepts: volkovlabs.io/grafana/. Grafana has a learning curve. When you got it, it's very rewarding experience.
Thank you very much for this awesome video. We have a business requirement to show / integrate the Grafana dashboard in one of our angular application (as home page). Could you suggest the best way for the same?
Thank you. We have more analytics and business videos planned. Stay tuned. The easiest way to integrate the Grafana dashboard is to use an . The latest version of Grafana is based on React framework, which is different from Angular.
@@volkovlabs If we use an , how do we manage the role based authorization in the system? Will the Grafana URL will be a public one? If it is a public one, I think, it is a data threat. How do we handle such a scenario?
@@syammohan2916 You can find an answer on the Community Grafana Forum: community.grafana.com/t/forward-authentication-to-grafana-embedded-in-an-/70295/2. We are avoiding mixing various application with Grafana creating plugins to add missing functionality.


What is your favorite part of this video? Let us know in the comments.
Check out the blog post for details: volkovlabs.io/blog/how-to-create-your-first-grafana-dashboard-bd0f68d631bd/
Thank for this video. It's very clear.
I'ld like to know if it's possible to get the dataset?
@@2jyen We explained in the blog post where we got it from: volkovlabs.io/blog/how-to-create-your-first-grafana-dashboard-bd0f68d631bd/#choose-a-dataset
@@volkovlabs Thank you very much
Can you elaborate more on timestamp 9:50 how to add line background in stat visualization
@@Kelyza14 To have line in the Stats panel you need to return many values (series) and then select last, min or max to display on top.
I really like the way you express yourself. Excellent content. Simple and straight to the point. His expression at 14:26 was hilarious.
Thank you. I am glad you like my humor.
Best Video on youtube for Grafana dashboard creation. thank you Daria !
Nice to hear that, thank you.
I came across this channel looking for some answers and I find it very interesting! As long as I dive deeper into subject, I begin to find the answers I was seeking. Thanks!
I am glad you found our content helpful.
thank you for the great quick start-up
You're welcome!
Thanks a lot for this great video! I'd like to ask you please to add the content of how to work with a Business Grafana Dashboard that uses time intelligence, not in time series like, but let's say having a calendar table in order to filter a fact table in which there are orders, with order date and shipping date, and being able to filter in a range of dates and get the total number of orders placed and shipped, or get the cumulative metrics such as YTD or QTD and so on. For many small companies, Grafana could be a great alternative to Power BI. I hope you could publish a Business Grafana Dashboard part 2! Thanks again for the great work!
Thank you for the great idea! We are planning to create Business Grafana dashboard part 2 which will include Calendar, Variable and other panels we developed and maintaining since publishing part 1. We will look into include the proposed topics in the new video.
thank. you so much for explaination in detail. I really understood everything whatever you explained.
Thank you. You made our day!
Vert simple and easy to follow instructions, Great quality and good work. Thank you
We appreciate the feedback. We have many tutorials on our channel to get your Grafana questions answered.
I really appreciate your efforts sharing this guide. It helped me a lot ! Thank you !
Glad it helped. Keep learning with us!
One of the best tutorials. Thank you.
Appreciate the feedback!
Thanks for the clear explanation!
You are welcome! Watch our other tutorials to hit the ground running with Grafana.
Very good and useful tutorial. Thank you!
You are welcome!
It really useful
Glad you liked it. We have a lot more on our channel.
Good afternoon, thank you very much for those excellent videos, a beautiful work that helps many people interested in these technologies, you could make a video where Apache echarts is used with grapher for 3D graphics. Thank you for existing, many blessings and infinite abundance.
Thank you for the feedback. We have not covered 3D graphics with Apache ECharts yet and will look into it. Please let us know if there is anything else.
Hi.. Thanks for a great video ! I have a request.. Can you please share the link to the table used in this video ?
You can find details in the blog post: volkovlabs.io/blog/how-to-create-your-first-grafana-dashboard-bd0f68d631bd/
When we have config in MySQL or PostgreSQL, we can add data source to a database, prepare a query to choose annotations, and show them in the calendar plugin. This is the second way to have access to annotation on our local Grafana instance. Of course, we ask for data from remote Grafana API is very useful.
Retrieving data from the Grafana or any other database you are not developing may be a short-term solution. For a long-term solution, we recommend using provided API.
super useful and very well organized. Kudos!!
By anychance, you have the postgres docker in the docker hub?
We use Timescale container for all our projects and tutorials: volkovlabs.io/blog/grafana-postgresql-20230123/
```
docker run -d --name timescaledb -p 5432:5432 \
-e POSTGRES_PASSWORD=password \
timescale/timescaledb:latest-pg14
```
@@volkovlabs thank you.
Great video. But I dont understand the red color on returned units. Could you explain it better?
It's a threshold configuration at 9:37. Values over 50 are marked as red. Grafana documentation: grafana.com/docs/grafana/latest/panels-visualizations/configure-thresholds/
Can you do a tutorial series for model monitoring services dashboard in grafana?
What kind of models you are interested in?
Hello ,great video! I just have one problem. I'm using the dummy database from postgreSQL and I am struggling with the filters. I have created them but I don't with what SQL statement you get them to work. I saw you used dollar sign but the statement to put does in I don't understand. Can you help?
If you are referencing to the template and dashboard variables, you can find more information in the Grafana Documentation: grafana.com/docs/grafana/latest/datasources/postgres/#templating
very helpful, grafana is frustrating as I try to find out where I need to make a change to get the visualization to look how I want, for example is the setting in the query, the side panel under visualization, or transformations like you just showed. Config from query results is a helpful transformation.
Thank you . We have many videos like this one in our Crash Course to explain main Grafana concepts: volkovlabs.io/grafana/. Grafana has a learning curve. When you got it, it's very rewarding experience.
@@volkovlabs Ty 🙏
Thanks for your very interesting videos... There is something I do not understand anyway: what is your business model? Plugins are free?
Thank you. All our plugins and projects are open-source and free to use. You are welcome to sponsor our work on GitHub github.com/sponsors/VolkovLabs
Thank you Maam for this Tutorial , Can you share the CSV/SQL file you used in this video ??? Please !!!!
You can find SQL create statement and other details in the blog: volkovlabs.io/blog/how-to-create-your-first-grafana-dashboard-bd0f68d631bd.
@@volkovlabs Thank you Maam🙌
Which version grafana are you referring
This is 1 year old video for Grafana 9. There is no big differences between Grafana 9 and 10, so everything should work as expected for G10.
Thank you very much for this awesome video. We have a business requirement to show / integrate the Grafana dashboard in one of our angular application (as home page). Could you suggest the best way for the same?
Thank you. We have more analytics and business videos planned. Stay tuned.
The easiest way to integrate the Grafana dashboard is to use an . The latest version of Grafana is based on React framework, which is different from Angular.
@@volkovlabs If we use an , how do we manage the role based authorization in the system? Will the Grafana URL will be a public one? If it is a public one, I think, it is a data threat. How do we handle such a scenario?
@@syammohan2916 You can find an answer on the Community Grafana Forum: community.grafana.com/t/forward-authentication-to-grafana-embedded-in-an-/70295/2.
We are avoiding mixing various application with Grafana creating plugins to add missing functionality.